Digital Agriculture
ISSN: request pending (Online) | ISSN: request pending (Print)
Email: [email protected]

The recognition of advance manifestation for illness is considerable innovation to agriculture and food industry as well as socio and environment related problems by providing food guarantee to more than 10 billion people in 2052 by increasing the yield, minimizing the yield drop and increase the potential of pesticides by decreasing the use of Phyto sanitary treatments.
Plant infection is the foremost criteria for the development of diseases in plants and then its deterioration. An expert system that can identify and exhibit such illness at their earliest stages is required for early diagnosis and treatment of these diseases. This will help us to combat and properly treat them. It wishes an expert to distinguish the methods of medicaments, introduce the disease and then to protect them. Accurate technique-based treatment identification is utilized in the detection of illness. Identification of illness and description of method for the cure can be done easily and distinctly with the help of expert systems since these systems are capable to do so.
Oerke [1] reported the diseased vegetation area, where severity is identified as part of zone which is contaminated and the yield loss is the bit of harvest which has a great impact on grade of the product. Observation of early manifestation is usually a breakthrough contemplated for unified pest control master plan of illness in cereals. As a consequence, exploration needs to concentrate on undertaking that can recognize illness in advance in order to prompt the targeted occupation, indication can be examined and endemic can be countered. The explanation needs to be attained in advance to reduce the analogous yield losses. Moreover, Savary et al. [2] says that the studies do show that yield loss per year assemble up to approximately $8 billion in the US.
To minimize the losses in durum wheat because of corrode epidemic Chai et al. [3] did a survey and said that these losses can be reduced by using crop preservation methods and also found that yield losses were reduced during 1984-1998 because of the use of herbicide. The yearly yield loss of 30-55% of cultivation fecundity is caused by effects of microbes, animals and unwanted herbs. Hence the use of crop preservation methods can reduce the loss risk remarkably. Nonetheless, the increment on the yield loss can be noticed since 2002 due to recent corrode varieties. The recent multiple toxic corrosion strain came out in 2013. Due to this, a large number of cereal varieties got pompous and new strain appeared to be hostile based on field examination. Unanticipated yearly climate conditions as well as the impact of weather variations for managing plant diseases can add unpredictability to resolution and persuade high incidence and acute eruption of local illness said Clark et al. [8].
Since recent microbes are developing, this is necessary to encounter forthcoming sickness in first stage to reduce yield losses. As, indications are not yet well developed so it's difficult to identify early. There is the requirement to issue image processing-based plant illness recognition to analyze illness in its primeval stage so that it can be prevented with crop protection implementation. It is too important to enhance the dependability of illness recognition and authenticate it on real surroundings. The appropriate statistics provide useful data for detecting a particular harm to the plant, counting biological and non-biological danger which could not be produced by other sensor devices. Abdulridha et al. [14] says that physical observation is very laborious as well as time taking so proposed an automatic computer vision detection method on cauliflower. One of the most important factors in identifying diseased plants is plant disease recognition. The disease of diagnosing plant is the initial step to identify the defected plants. Plants should be identified using both their scientific and common names. Since some clearly separate plant species can share the same general identification and the general identification applied in one place can be applied for a completely distinct species in another, general identification shouldn't be depended upon.
Governments are in charge of safeguarding domestic agricultural and natural plant systems from invading pathogens and putting policies in place to stop their own endemic infections from spreading to neighboring countries.
To improve the sample quality of tomatoes, the leaf samples of tomatoes are extracted using a combination of descriptors using ML model. The recovered characteristics are classified using Expert System methods including KNN, SVM, and CNN. K-NN (97%), SVM (88%), and CNN (99.6%) are utilized to measure the precision of the proposed model on tomato disordered by Harakannanavar et al. [4]. The classification of tomato plant leaves is carried out by Soo et al. [5]. using the machine learning programme Extreme learning machine. In comparison to alternative methods like the SVM and Decision Tree, the ELM's output exhibits a higher accuracy of 84.94%.
A plant disease recognition and categorization approach based on the improved ultralight YOLOv5 model is suggested in order to increase the speed and precision of disease diagnosis by Vishnoi et al. [6] using IASM application. The findings demonstrate that the optimized model's response time and correctness are respectively 11.8% and 3.98% and 92.65% greater than those of the previous design, which better emphasizes statistical metrics than the similar to the actual methods.
In this investigation an intuition to an amenable system is identified to determine vegetables and fruits diseases by techniques of image processing in alliance with statistical deduction methods to resolve the above quoted technical issue. Plant sickness recognition includes the assurance of prospect that a specific illness is present. The harm is caused the exterior of plants (e.g. roots, leaves, stems, blossoms etc.) due to the illness. Consequently, quality symptoms start to show on some infected plant portions.
The plant illness is recognized by digital vision prognosis methods. The spotting of plant illness is made possible by space station or aerial remote sensing. Huang et al. [7] studied aerial spectrographic images and in-situ for estimation of shadowy guide to encounter yellow rust in wheat. Thomidis et al. [16] expanded phantom illness hint to identify the presence of fructose beet sickness by choosing the two most univariate spectra per sickness, whereas Marin et al. [21] extricated suitable incorporeal guide by a conquered greet. In spite of the fact that, these techniques are suitable to estimate and recognize the expansion of illness over a region, they fail on the observation of prompt manifestation as they need the existence of early features so that the illness on its later phase could be determined by smooth soaring imagery. Mechanized canvas investigation is the method used to determine the illness Based on early manifestation. Sannakki et al. [9] inaugurated an address to mechanized class illness on plant leaves. The resemblance clarification method is used for the analysis of color fixed details in the image of an ill plant. A k-means congregate procedure is carried out for every pixel in the image to draw out clump with contaminated spots. An illness is set on by recruiting Aristotelian logic on plant leaves. The high reckoning attempt is required for portrayal deputation and some inventiveness has decreased the computing cost represented by Xie et al. [10]. Siricharoean et al. [11] adequately used address consisting of texture, color, configuration, characteristic to identify the sickness. Various inventiveness such as plant village [12] have rescued about 53000 adeptly pastor depiction of contaminated and well leaves of various thong (apple, grapes, blueberry). The concept of deep complexity expert system has been bought by Sladojevic et al. [13] procuring greater precision when the testing portrays belonged to the exact dataset. The established origin represents that precision of model has been demeaned to 33%. The database is used as a real automated farming implementation due to which it is taken under superintend state. The stereotype is instructed in such a way that it can notice the most apparent illness which is not mandatory the foremost one for the crop.
To develop an automatic fruits and vegetable detection system using OPEN-VINO, data were collected from multiple resources. To build up a mechanism of different diseases, a large amount of database has been formed for fruits and vegetable diseases such as pepper, potato, apple, blueberry, squash, strawberry, cherry, corn, grapes, peach, raspberry, soybean, tomato different fruits and vegetables has been taken. In a survey (1992-2000), 28 diseases were observed in apple in South Korea. These illnesses included bitter rot, Marssonina blotch, Valsa canker, White Rot (Botryosphaeria dothidea), Marssonina mail, and Valsa ceratosperma (Collectotrichum gloeosporioides and C. acutatum). In this investigation, three new diseases were discovered: pink rot (Trichothecium roseum), brown rot (Monilinia fructigena), and bloom blight (Monilinia mail). The texture feature such as discrete wavelet feature, histogram of oriented gradients (HOG), laws texture energy (LTE), gray level co-occurrence matrix (GLCM) and Tamura features has been taken to compare with healthy apple by Singh et al. [15]. Kai et al. [17] provided a technique employs YCbCr color space technology to segment the disease spot, the co-occurrence matrix spatial grey level layer to extract the texture information from the illness spot, and the BP neural network to categories the maize disease. Wilcox et al. [18] given the grapes can contract a number of infectious diseases that are brought on by fungi, oomycetes, bacteria, phytoplasmas, and viruses. Pierce's disease (PD) [caused by Xylella fastidiosa], Citrus variegated chlorosis [induced by xylem-limited], Huanglongbing illnesses [China in the early 19s], and Citrus canker [caused by Xanthomonas axonopodis] are some of the bacterial diseases that affect oranges. Viral diseases such as Citrus Tristez, citrus Ringspot Virus (1896 USA), and Nematode Diseases. Fungal diseases as sweet orange scab (SOS), powdery mildew (caused by Acrosporium tingitaninum) and Capsium annumL (1984-1986, Ethiopia) were identified by Etebu et al. [19]. Kreuze et al. [20]Potato has various bacterial and fungal diseases. Bacterial diseases such as bacterial wilt, black leg, potato ring rot, pink eye. Fungal diseases late blight [Phytophthora infestans], silver scurf [Helminthosporium solani], black scurf [Rhizoctonia solani], dry rot [Fusarium sambucinum]. Marin et al. [21] says that Strawberry has various bacterial diseases such as yellows and crinkles. Fungus diseases such as red stele, Verticillium Wilt, Black root-rot, Nematode infection.
Various type of tomato viruses is pepino mosaic which was established itself, tomato torrado virus Van der Vlugt et al. [22]. For prevention allows 2 years gap between tomatoes, peppers or potatoes and strawberry. A newly introduced virus may spread successfully as a result of changing climatic conditions. Various samples or pictures has been taken through many objects Ngugi et al. [23]. Different features are being classified for different fruits and vegetables.
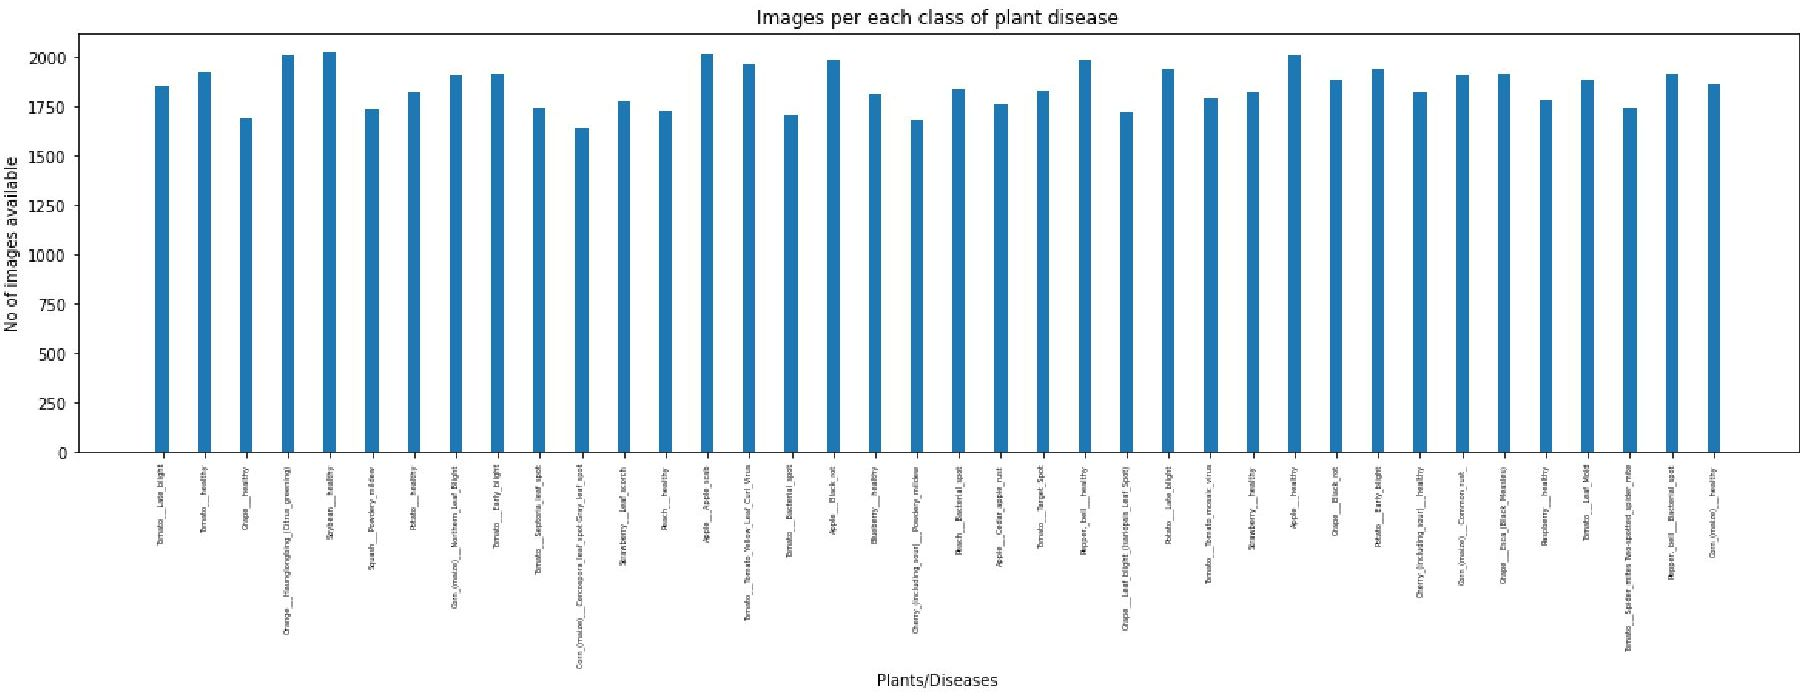
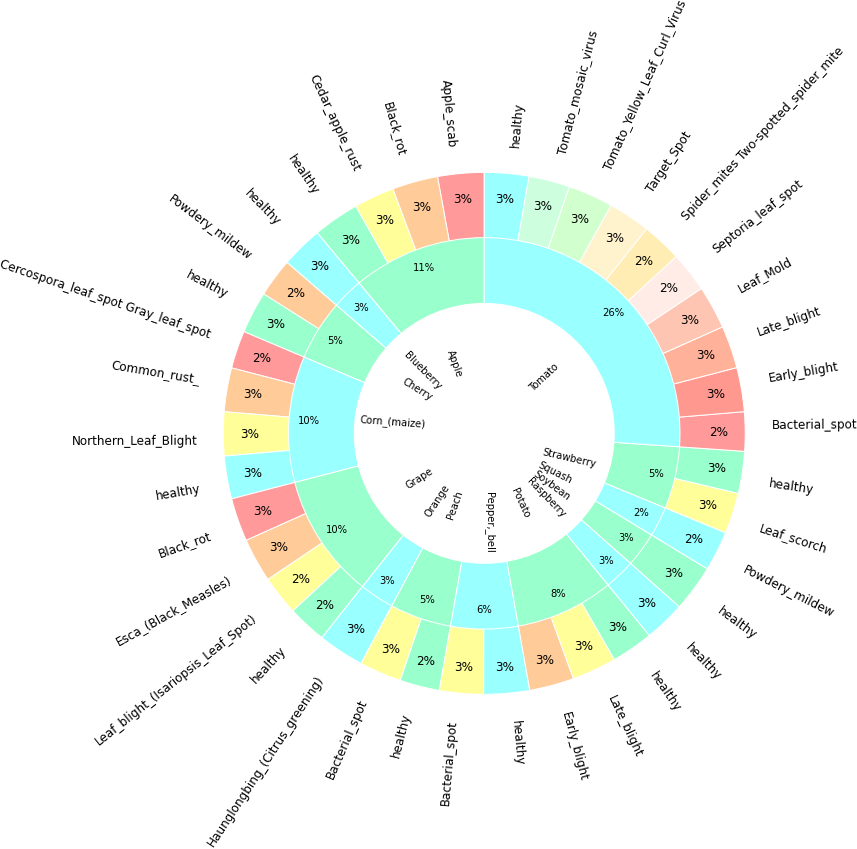
In direction to create a design to classify diseases of fruits and vegetable a dataset has been obtained which is having images of different types of diseases of fruits and vegetables. Although this dataset is for apple tomato blueberry, cherry, corn, grapes, peach, pepper, potato, raspberry, soybean, squash, strawberry but this design is applicable for any kind of fruits and vegetables. Table 1 shows the data set for the images of disease vegetables and fruits. Furthermore, Figure 1 is visualizing the Table 1 data and Figure 2 is visualizing the class data distribution.
Description of dataset: The directory structure is preserved as the training and validation sets are split up into training and validation sets in an 80/20 ratio.Number of unique plants: 14 Number of unique diseases: 26.Found 70295 pictures from 38 different train dataset classifications. Found 17572 pictures from 38 classes in the test dataset.
| Disease Classes |
|
||
|---|---|---|---|
| Corn (maize) healthy | 1859 | ||
| Pepper, bell Bacterial spot | 1913 | ||
| Tomato Spider mites Two-spotted spider mite | 1741 | ||
| Tomato Leaf Mold | 1882 | ||
| Raspberry healthy | 1781 | ||
| Tomato Leaf Mold | 1882 | ||
| Raspberry healthy | 1781 | ||
| Grape Esca (Black Measles) | 1920 | ||
| Corn (maize) Common rust | 1907 | ||
| Cherry (including sour) healthy | 1826 | ||
| Potato Early blight | 1939 | ||
| Grape Black rot | 1888 | ||
| Apple healthy | 2008 | ||
| Strawberry healthy | 1824 | ||
| Tomato Tomato mosaic virus | 1790 | ||
| Potato Late blight | 1939 | ||
| Grape Leaf blight (Isariopsis Leaf Spot) | 1722 | ||
| Pepper, bell healthy | 1988 | ||
| Tomato Target Spot | 1827 | ||
| Apple Cedar apple rust | 1760 | ||
| Peach Bacterial spot | 1838 | ||
| Cherry (including sour) Powdery mildew | 1683 | ||
| Blueberry healthy | 1816 | ||
| Apple Black rot | 1987 | ||
| Tomato Bacterial spot | 1702 | ||
| Tomato Tomato Yellow Leaf Curl Virus | 1961 | ||
| Apple Apple scab | 2016 | ||
| Peach healthy | 1728 | ||
| Strawberry Leaf scorch | 1774 | ||
| Corn (maize) Cercospora leaf spot Gray leaf spot | 1642 | ||
| Tomato Septoria leaf spot | 1745 | ||
| Tomato Early blight | 1920 | ||
| Corn (maize) Northern Leaf Blight | 1908 | ||
| Potato healthy | 1824 | ||
| Squash Powdery mildew | 1736 | ||
| Soybean healthy | 2022 | ||
| Orange Haunglongbing (Citrus greening) | 2010 | ||
| Grape healthy | 1692 | ||
| Tomato healthy | 1926 | ||
| Tomato Late blight | 1851 |
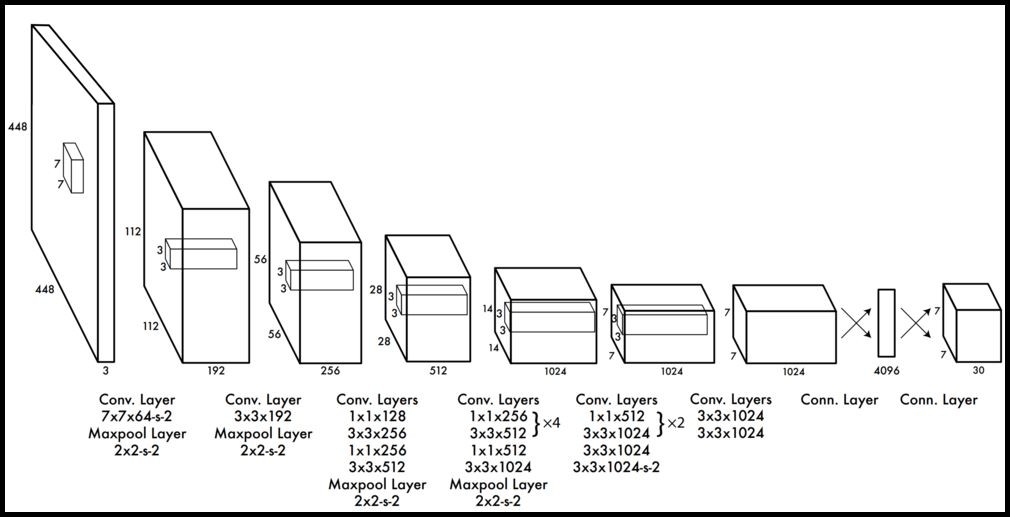
It has been determined to use the YOLOv3 model architecture for computer vision model training. " You only look once," or YOLO, is one of the quickest object identification techniques now in use. Even if it is no longer the most precise object detection algorithm, it is still a fantastic option when real-time identification is necessary with correctness. A variation of Darknet, primitively a Image Net-trained 53-layer network, is used by YOLO v3. To detect, 53 additional layers are added to it, providing YOLO v3 a 106-layer completely convolution basic architecture. The provided architecture itself tells that why YOLO v2 works faster than YOLO v3.
The fact that v3 identifies at three separate scales is its most notable feature. By applying it to a feature map, the fully convolution network YOLO creates its final output using a one-by-one kernel. YOLOv3 works at three separate dimensions with three separate positions throughout the network by the application of one-by-one identification kernels to feature maps. The detection kernel has the following dimensions: (one by one by (B by (five + C). In this case," five" expresses the 4 bounding rectangle characteristics and 1 article conviction, and" B" expresses the maximum number of bounding rectangles that a characteristic dimension map cell can anticipate.
The number of sections is C. YOLO v3 which is trained on COCO has values B = three and C = zero. The 3 parameters at which YOLO v3 predicts are correctly calculated by sub sampling the input image's measurements by thirty-two, sixteen, and eighteen accordingly. The eighty second layer does the initial identification. The system sub samples the image for the initial eighty-one layers, giving the eighty first layer a stride of thirty-two. With an image of four hundred sixteen by four hundred sixteen in this model, the resulting feature dimension would be thirteen by thirteen. Here, 1 identification is performed by the one-by-one identification kernel, providing a thirteen by thirteen by two hundred fifty-five identification feature maps. At this level a number of convolution layers are applied to the map of feature from seventy-nine layer after that it is up sampled to two by two. Then the feature map from layer sixty-one and layer seventy-nine are depth concatenated. After that, a few 1 by 1 convolution layers are enforced to the combined feature maps to assimilate the features from the preceding layer (61). After that the ninety fourth layer performs the 2nd identification, creating a twenty-six by twenty-six by two hundred fifty-five identification feature maps. Once more, a similar process is used, in which layers from ninety-one to thirty-six are depth concatenated with their feature maps when these layers are already being exposed to a number of convolution layers. To combine the data from its previous layer, a number of one-by-one convolution layers are added after the first thirty-six layers. We create the third and final layer at one hundred sixth layer, which gives a feature map that is fifty-two by fifty-two by two hundred fifty-five.
A usual problem with YOLO v2 is that it faces difficulty in recognizing little things, however YOLO v3 is better at doing so, that is an important aspect necessary to identify diseases in vegetable plants at different positions. When previous layers are concatenated with the up sampled layers an exquisite aspect generates which is able to identify small objects. Figure 3 shows the YOLO v3 architecture.
A graphic tool for image annotation is called labeling. This graphical tool is developed in python and QT is its graphical user interface. Notations are written in the image net-compatible PASCAL VOC (XML files). In addition to it, it also helps the YOLO format. The YOLOv3 format for image notations has been used. For mining the data from image and for its conversion in YOLOv3 format labeling has been used.
The projected , , , and are used to predict the final bounding box coordinates, as illustrated in Figure 4, which shows the transformation from anchor box priors and predicted offsets to the actual bounding box. This includes applying sigmoid functions and exponential mappings to refine box position and scale.
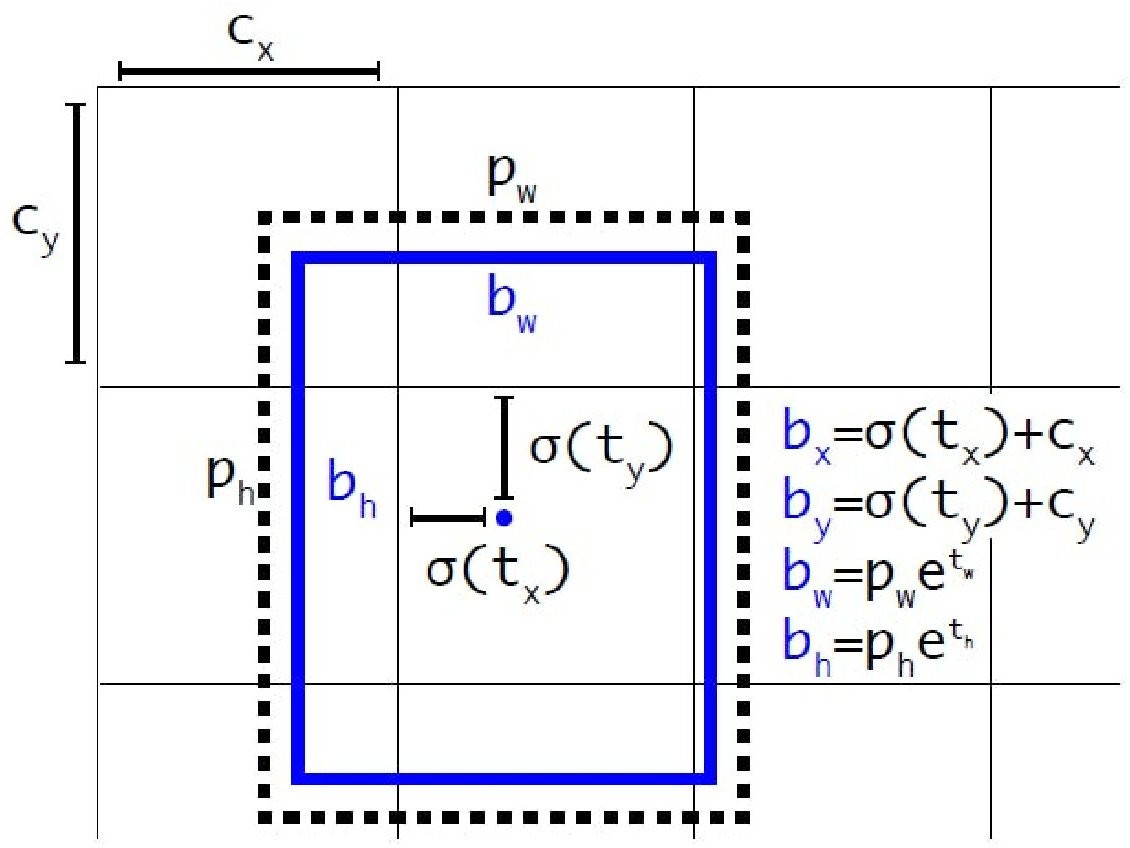
Additionally, logistic regression is used to predict objectness score. If the bounding box prior overlaps an object in the ground truth more than any other bounding box prior, the value is 1. Each ground truth object is given a single bounding box previously.
Instead of using soft-max, independent logistic classifiers are used and binary cross-entropy loss is used. Because there may be overlapping labels for multi-label classification such as if the YOLO v3 is moved to other more complex domain such as Open Images Dataset. Prediction across scales are as follows:
Instead of using soft-max, binary cross-entropy loss is applied together with independent logistic classifiers. Because multi-label classification may result in overlapping labels, such as if the YOLO v3 is shifted to a more complicated domain like the open images dataset.
Prediction on different scales.
There are 3 distinct scales.
These scales are used to extract features using Feature Pyramid Networks.
Several convolution layers have been added to the Dark net-53's base feature extractor (which is mentioned in the next section).
The final of these layers makes predictions about bounding box, objectness, and class.
Three boxes at each scale on the COCO dataset. Since there are 4 bounding box offsets, 1 objectness prediction, and 80 class predictions, the output tensor is NN [3 (4+1+80)].
The feature map is then taken from two levels earlier and is two times up-sampled. Concatenation is used to combine our up-sampled data with a feature map from previously in the network.
With the use of this technique, we can extract more insightful semantic data from the un-sampled features and finer-grained data from the previous feature map.
After processing this merged feature map with a few more convolution layers, a similar tensor that is now twice as large is predicted.
To discover a superior bounding box beforehand, k-means clustering is also applied in this case.
Finally, the COCO dataset uses the following values: (10.13, 16.30, 33.23, 30.61,62.45, 59.119, 116.90, 156.198, and 373.326). There are 70295 images for training.
With a confidence value of 0.68, the disease cedar rust is identified in Figure 5 followed by Sheth [24]. The black background, which was not trained in the model, is to blame for the decline in the confidence score. Since the cedar rust was trained with a green natural background, the confidence rating decreased when an image with a black background was taken. When the detection is conducted against a green backdrop, the confidence rises to 0.86 and 0.91. As a result, this model outperforms demo photos in a real-world setting.
| Layer (type) | Output shape | Param # |
| conv2d (Conv2D) | (None, 62, 62, 128) | 3584 |
| max pooling2d (MaxPooling2D) | (None, 31, 31, 128) | 0 |
| batch normalization | (None, 31, 31, 128) | 512 |
| conv2d 1 (Conv2D) | (None, 29, 29, 256) | 295168 |
| max pooling2d 1 (MaxPooling2D) | (None, 14, 14, 256) | 0 |
| batch normalization 1 | (None, 14, 14, 256) | 1024 |
| conv2d 2 (Conv2D) | (None, 12, 12, 512) | 1180160 |
| max pooling2d 2 (MaxPooling2D) | (None, 6, 6, 512) | 0 |
| batch normalization 2 | (None, 6, 6, 512) | 2048 |
| flatten (Flatten) | (None, 18432) | 0 |
| dense (Dense) | (None, 512) | 9437696 |
| dropout (Dropout) | (None, 512) | 0 |
| dense 1 (Dense) | (None, 256) | 131328 |
| dropout 1 (Dropout) | (None, 256) | 0 |
| dense 2 (Dense) | (None, 38) | 9766 |
| Total parameters: 11,061,286 | ||
| Trainable parameters: 11,059,494 | ||
| Non-trainable parameters: 1,792 | ||
For faster disease categorization, it has been decided to create a Python script for converting YOLO v3 to Open-Vino IR format. The two files that make up YOLO models, which were initially implemented in the Dark-Net* framework, are:
A .cfg file with model settings.
Model weights in a weights file.
The Model Optimizer translates a YOLO model in different ways depending on the version.
There are numerous YOLO v3 implementations.
The YOLO v3 model is used in this, which can be immediately translated to the IR using tensor-flow.
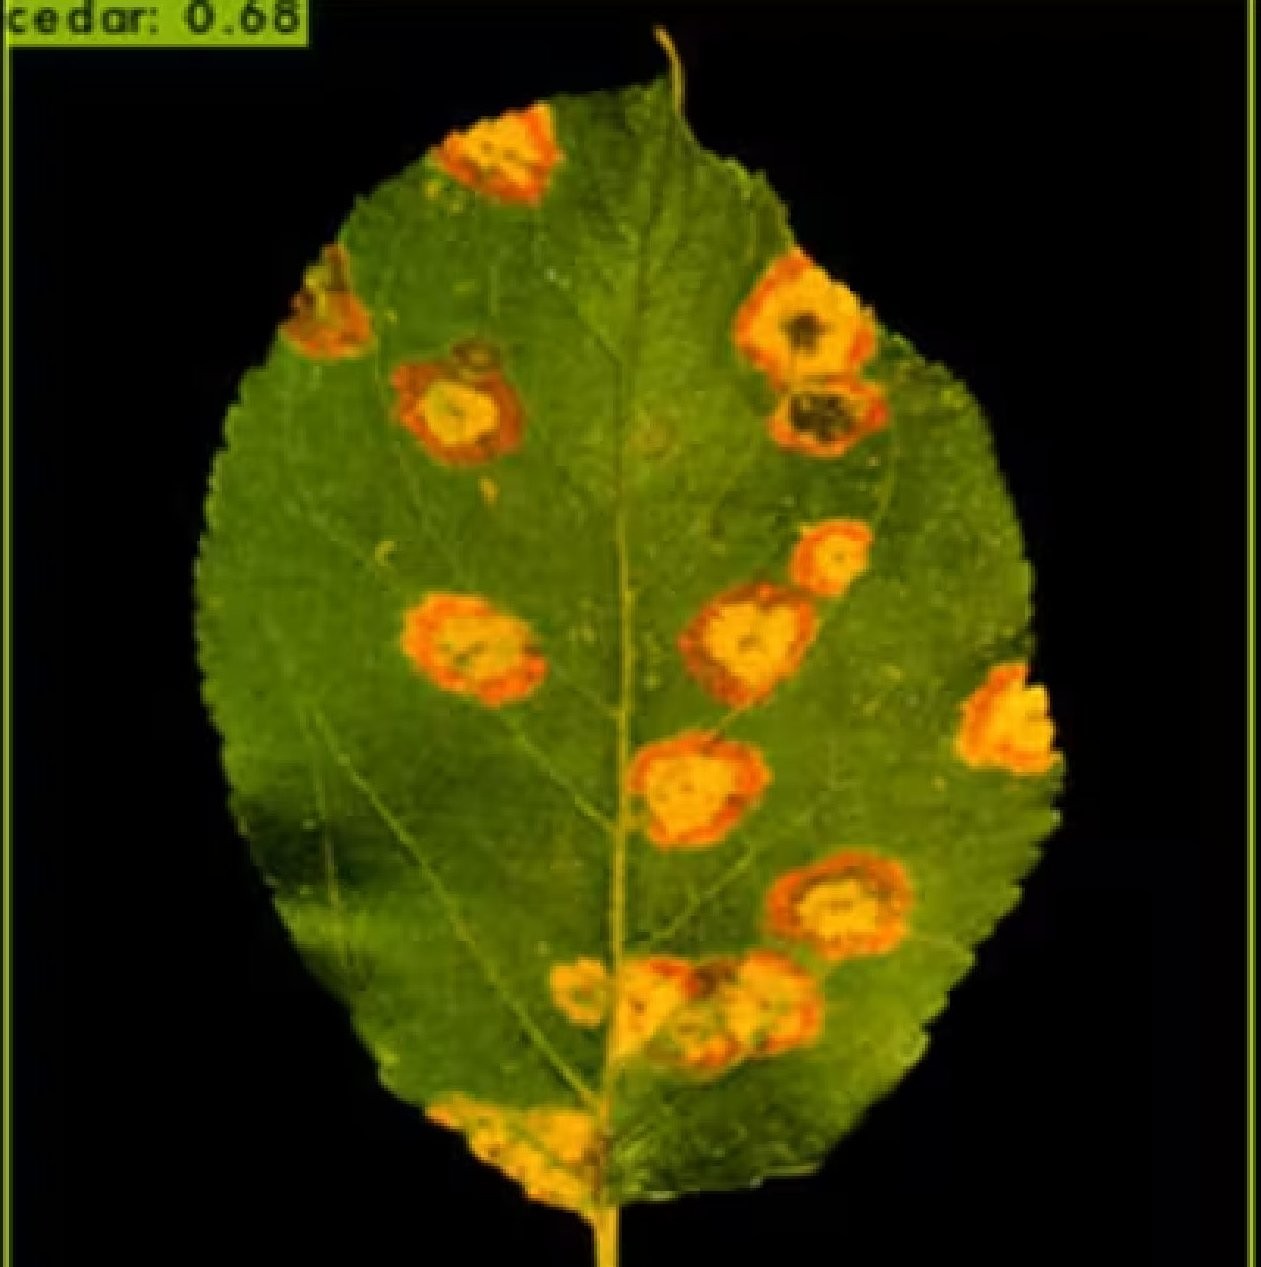
Table 2 represents the model summary for vegetables disease detection. There are 3584 parameters in conv2d. This is calculated as follows: 128 (output values) + 62 (first-layer neurons) (bias values). We also obtain the parameters for a different model. Because each hidden unit has 18432 input weights and one weight of connection with bias, there are 11,061,286 parameters total. As a result, each concealed unit provides you with one of the 11,061,286 parameters.
Figure 6 denotes the loss of accuracy with epoch on training and testing comprising 70295 and 17572 images of plant diseases respectively belonging to 38 classes. Blue Line shows validation loss in graph and orange line shows training loss.
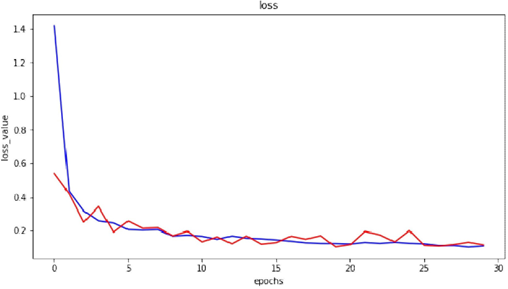
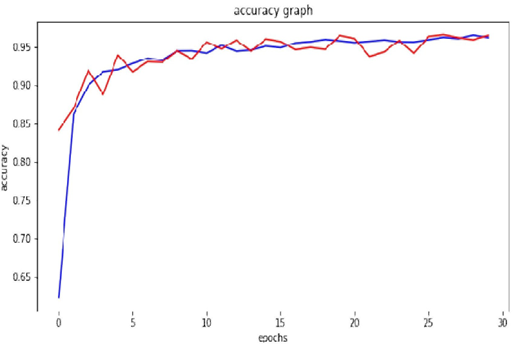
Figure 7 represents the accuracy with epoch on training and testing comprising 70295 images and 17572 images of plant diseases respectively belonging to 38 classes. Blue line shows validation accuracy and red line shows training accuracy.
Train accuracy: On applying Open-VINO model to train dataset of plant diseases, 98.70% accuracy is achieved.
Test accuracy: On applying Open-VINO model to test dataset of plant diseases, 98.78% accuracy is achieved.
Precision score: Precision is the ratio where tp is the number of true positives and fp the number of false positives. The precision is intuitively the ability of the classifier not to label as positive a sample that is negative. The best value is 1 and the worst value is 0. While testing it has been Precision Score: 96.77%.
Comparison:Open-VINO (CPU) average (sec):0.024, fps:40.6 Tensor-flow average (sec):0.069, fps:14.3 Keras average (sec):0.079, fps:12.5
In this investigation, numerous deep studying techniques proposed through many scholars with inside the area of fruit detection and class are analyzed. While reading exclusive computerized strategies for fruit detection, It is observed that preceding assessment papers targeted at the software of laptop imaginative and prescient strategies with inside the area. To fill this gap, we carried out an updated assessment of the lately posted literature with inside the area of fruit detection that applied machine learning technique as Open-VINO model. Open-VINO technology can be used to automate traditional farming. For example, prevention of disease at early stages in plant. Auto sprinkling of pesticides through drones after diseases is detected. Consequently, It has been observed that Open-VINO technology increases performance of model by 4 times so plant diseases identification can be done in short interval of time.
 Copyright © 2025 by the Author(s). Published by Institute of Central Computation and Knowledge. This article is an open access article distributed under the terms and conditions of the Creative Commons Attribution (CC BY) license (https://creativecommons.org/licenses/by/4.0/), which permits use, sharing, adaptation, distribution and reproduction in any medium or format, as long as you give appropriate credit to the original author(s) and the source, provide a link to the Creative Commons licence, and indicate if changes were made.
 Digital Agriculture
ISSN: request pending (Online) | ISSN: request pending (Print)
Email: [email protected]

Portico
All published articles are preserved here permanently:
https://www.portico.org/publishers/icck/