
Chinese Journal of Information Fusion
ISSN: 2998-3371 (Online) | ISSN: 2998-3363 (Print)
Email: [email protected]

As a core component of modern electronic devices, the display panel plays a critical role in shaping the end-user's visual experience. However, due to inherent limitations in material properties, manufacturing techniques, and production environments, surface defects on display screens remain difficult to avoid during the fabrication process [1]. Among the various display quality defects, Mura defects, which refer to brightness non-uniformity, are particularly prominent. They often cause visible brightness variations on the screen and significantly impair the overall visual experience [2]. Unlike local defects such as dot or line defects, Mura defects typically span large areas, exhibit complex and diverse patterns, and involve subtle brightness variations, posing significant challenges for traditional detection methods in terms of both identification and localization. Moreover, this brightness non-uniformity not only affects visual performance but may also reduce the lifespan of the display. Therefore, accurately detecting and effectively segmenting non-uniform regions on the screen has become a critical issue that demands urgent attention [3].
Traditional Mura defect detection methods are primarily based on image processing techniques, including frequency domain analysis [20, 4], filtering and statistical analysis [5, 6], and low-rank matrix decomposition. Frequency domain approaches, such as Fourier transform and discrete cosine transform, achieve defect segmentation by removing background textures. However, their high computational cost in background reconstruction limits their applicability in real-time scenarios. Filtering and statistical methods rely on techniques like mean filtering [7] and Gaussian filtering [8] to highlight non-uniform regions, followed by threshold-based segmentation. However, these methods are prone to interference from local features when handling complex or subtle defects and are highly sensitive to parameter settings, resulting in limited adaptability. Low-rank matrix decomposition models the background as a low-rank matrix and treats defects as sparse components, separating the two via optimization algorithms. Although this approach shows promising performance in Mura defect detection, its high computational complexity similarly restricts its use in real-time industrial applications. Overall, while traditional methods may be effective in specific scenarios, they generally suffer from strong dependence on background regularity, high computational costs, and poor generalization, making them insufficient for the diverse demands of Mura defect detection in practical industrial settings [9].
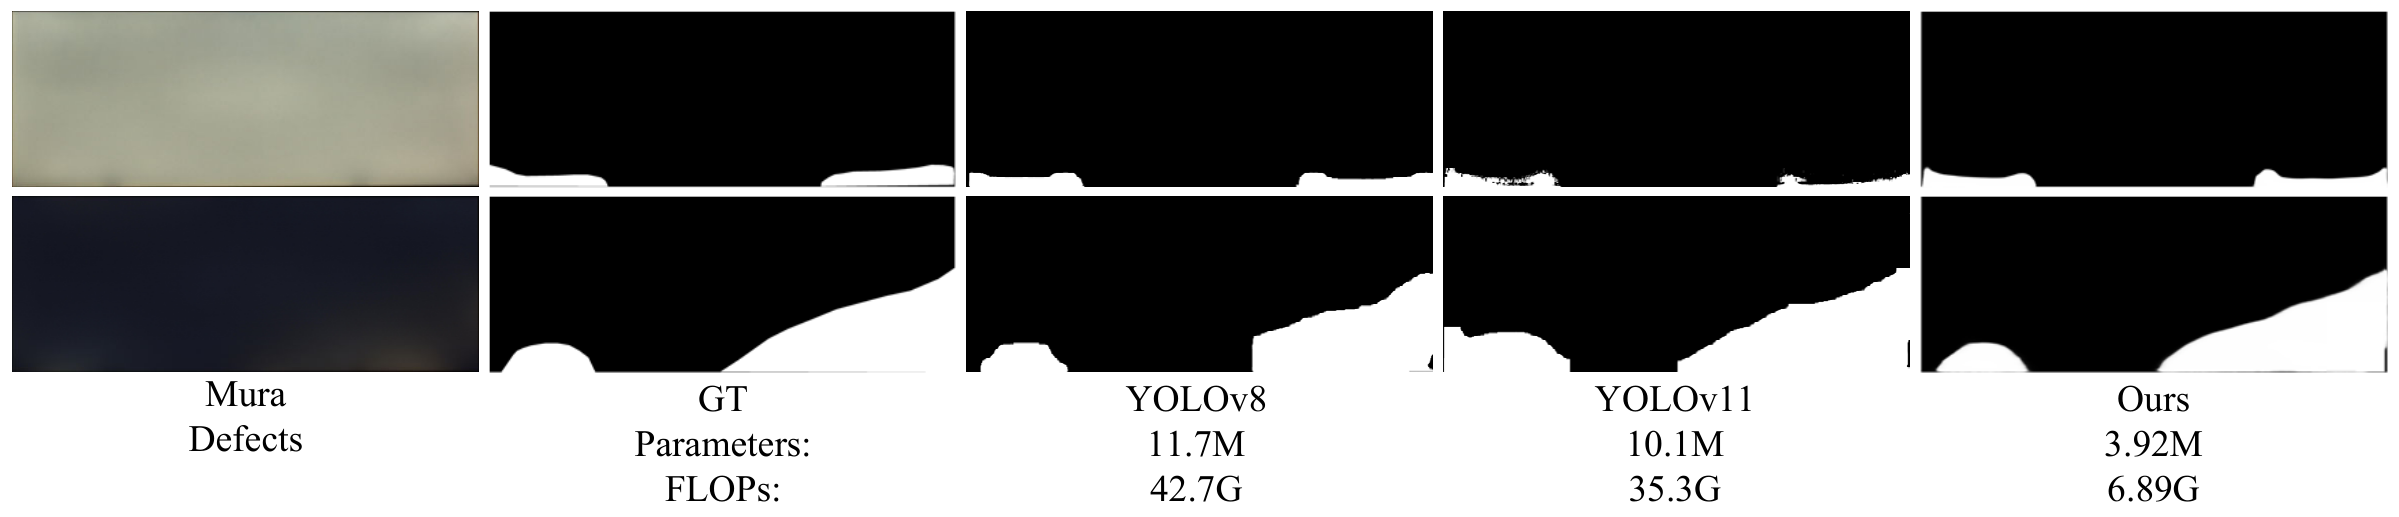
In recent years, the rapid advancement of display technology has led to high-resolution and large-size panels becoming the market mainstream, imposing greater demands on large-area Mura defect detection. Higher resolutions require algorithms to process significantly larger volumes of data, while increased panel sizes add complexity to the detection task. At the same time, the rise of deep learning has introduced new perspectives for tackling Mura defects. Detection methods based on Convolutional Neural Networks (CNNs) have become the dominant approach, offering efficient feature extraction and semantic segmentation through end-to-end training frameworks. Significant progress has been made in applying deep learning to LCD defect detection, with three main research directions emerging: (1) Optimization and application of enhancements of object detection model to classical architectures such as YOLO [10] and RetinaNet [11], combined with attention mechanisms, have improved performance in complex backgrounds and for various defect types; (2) Addressing the scarcity of labeled data through transfer learning and unsupervised learning approaches, reducing the reliance on large-scale annotated datasets and improving model adaptability [12, 13]; (3) Combining lightweight network designs with data augmentation strategies to reduce computational overhead and enable real-time detection in resource-constrained environments [14]. Nevertheless, existing object detection networks remain limited in their ability to handle large-area Mura defects with blurred boundaries, and often struggle to balance detection accuracy with the stringent real-time requirements of industrial settings, as illustrated in Figure 1.
Moreover, compared to conventional display defect detection, Mura defect detection presents distinct differences in both research focus and technical requirements. It emphasizes the overall brightness distribution across the screen rather than the specific shapes of localized defects. As a result, the task requires capturing large-scale brightness gradients and non-uniformities, which often lack clear boundaries or geometric features. Furthermore, Mura defects typically exhibit diffuse patterns and are influenced by complex factors such as backlighting, display environment, and screen content, making general object detection methods difficult to apply effectively. Large-area Mura defect detection faces several key challenges: (1) Mura defects often appear as subtle brightness gradients or broad regions of uneven illumination, making them difficult to differentiate from the background; (2) These defects generally lack sharp boundaries or distinct structural cues, complicating accurate localization; (3) Limited availability of annotated defect samples hinders model training and restricts generalization capabilities; (4) Processing high-resolution images demands greater computational efficiency and detection accuracy, requiring methods that balance precision with real-time performance.
To address the above challenges, we focus on developing a lightweight deep learning-based method for large-area Mura defect detection. We propose a novel lightweight Semantic Interscale Integration and Neighbor Fusion-based network, termed SIFNet, which aims to enhance Mura defect detection performance while maintaining a lightweight design suitable for industrial applications. Specifically, we adopt a commonly used encoder-decoder structure with MobileNet-V2 [17] as the backbone. To effectively capture large-area Mura defects and enhance the model's sensitivity to subtle brightness variations, we design a Graph-based Semantic Interscale Fusion Block (GSIB). This block integrates high-level semantic information across spatial scales and models global feature relationships within Mura defect regions, while maintaining low computational complexity. GSIB consists of two submodules: the Semantic Fluid Aggregation Module (SFAM) and the Semantic Graph Inference Module (SGIM). SFAM adopts a holistic strategy to extract global semantic cues, while SGIM employs graph convolution operations to explicitly model cross-scale semantic relationships by constructing higher-order connections between layers. To further improve the model's ability to detect fine boundary features in regions of brightness non-uniformity, we introduce the NeighborFusion Edge Enhancement Module (NEEM). NEEM enhances edge representation by mining spatial correlations between multilevel features. Finally, to address the diverse scales and morphologies of Mura defects, we design a lightweight multiscale decoder for accurate detection across varying defect sizes. In summary, our main contributions are as follows:
We propose a novel lightweight network, SIFNet, for large-area Mura defect detection, and construct three high-resolution large-area Mura defect datasets to support model training and evaluation.
We design a lightweight Graph-based Semantic Interscale-fusion Block (GSIB) to effectively capture large-area Mura defects and subtle brightness variations. GSIB integrates multi-level deep semantic features and models cross-scale relationships through two components: SFAM, which extracts holistic semantic cues, and SGIM, which builds high-order dependencies via graph convolution.
We propose a lightweight NeighborFusion Edge Enhancement Module (NEEM) that strengthens spatial correlations among multi-level features and reinforces edge representations, thereby improving the model's sensitivity to subtle boundary features in Mura defect regions.
Comprehensive experiments on the proposed datasets demonstrate that our method achieves state-of-the-art performance while being lightweight, highlighting its suitability for industrial applications.
Early traditional defect detection methods primarily relied on thresholding, edge information, feature extractors, and classifiers for defect classification and localization. Sun et al. [18] proposed a cascaded Mura detection approach based on mean shift and level set algorithms, where the mean shift algorithm is first used to locate potential defect regions, followed by segmentation using the level set method. Chen et al. [19] addressed the challenge of detecting Mura defects with low brightness contrast against the background by proposing a background reconstruction method based on discrete cosine transform (DCT), generating a background image separated from the defect. They further quantified the saliency of Mura defects using the Just Noticeable Difference (JND) model. Tsai et al. [20] tackled the difficulties of detecting defects in large-size, high-density LCDs with complex and irregular patterns by applying Fourier-based image reconstruction to remove periodic backgrounds from 1D line patterns, enabling accurate segmentation of local anomalies. Cui et al. [21] employed three visual-based techniques for display defect detection and used OTSU thresholding to segment multiple defect types across various uniform background colors. Chen et al. [22] proposed a salt-and-pepper defect detection method using mean filtering and statistical control charts. The method first identifies defect pixels via mean filtering and binarization, then monitors the number of detected pixels with a control chart to determine panel-level defects. However, these traditional methods typically rely on background regularity, involve high computational costs, and have limited adaptability in complex or variable scenarios. Moreover, their accuracy is often unstable, making them unsuitable for direct deployment on industrial production lines.
With the rapid development of deep learning, many methods have adopted end-to-end training frameworks that enable efficient extraction of display defect features and semantic segmentation. In the field of LCD defect detection, deep learning-based approaches have made notable progress, with research primarily centered on the optimization and application of general object detection models. Zhu et al. [23] employed YOLOv3 as the detection framework to identify defects and noise under varying backgrounds and viewing angles. By subtracting the noise detection results from the defect results, the method achieved a more accurate defect localization. Çelik et al. [24] analyzed deep learning-based LCD defect detectors using RetinaNet, YOLOv3, and M2Det, and found that RetinaNet offered the best balance between accuracy and processing time. Luo et al. [9] improved the YOLOv5 backbone by widening both shallow and deep convolutional layers, and proposed a shallow semantic fusion module to enhance the utilization of low-level features. They also introduced a contrast-enhancing attention mechanism to strengthen feature representations across spatial and channel dimensions.
Furthermore, extensive efforts have been made to design efficient neural network architectures that reduce computational overhead while improving detection accuracy. Lin et al. [25] used MobileNet as a baseline and incorporated a channel attention mechanism to enhance channel-wise features for Mura defect detection in LCDs. Chen et al. [14], building upon the YOLOv4-tiny framework, integrated atrous spatial pyramid pooling and depthwise separable convolutions to expand the receptive field, while spatial and channel attention modules were applied to further enhance feature maps. These improvements enable faster and more precise defect detection, supporting real-time applications in resource-constrained environments.
In this section, we provide a detailed description of the proposed lightweight SIFNet. Section 3.1 presents an overview of the overall architecture. Sections 3.2 and 3.3 explain the two lightweight modules, GSIB and NEEM, respectively. Finally, Section 3.4 describes the decoder structure and the loss function used for training.
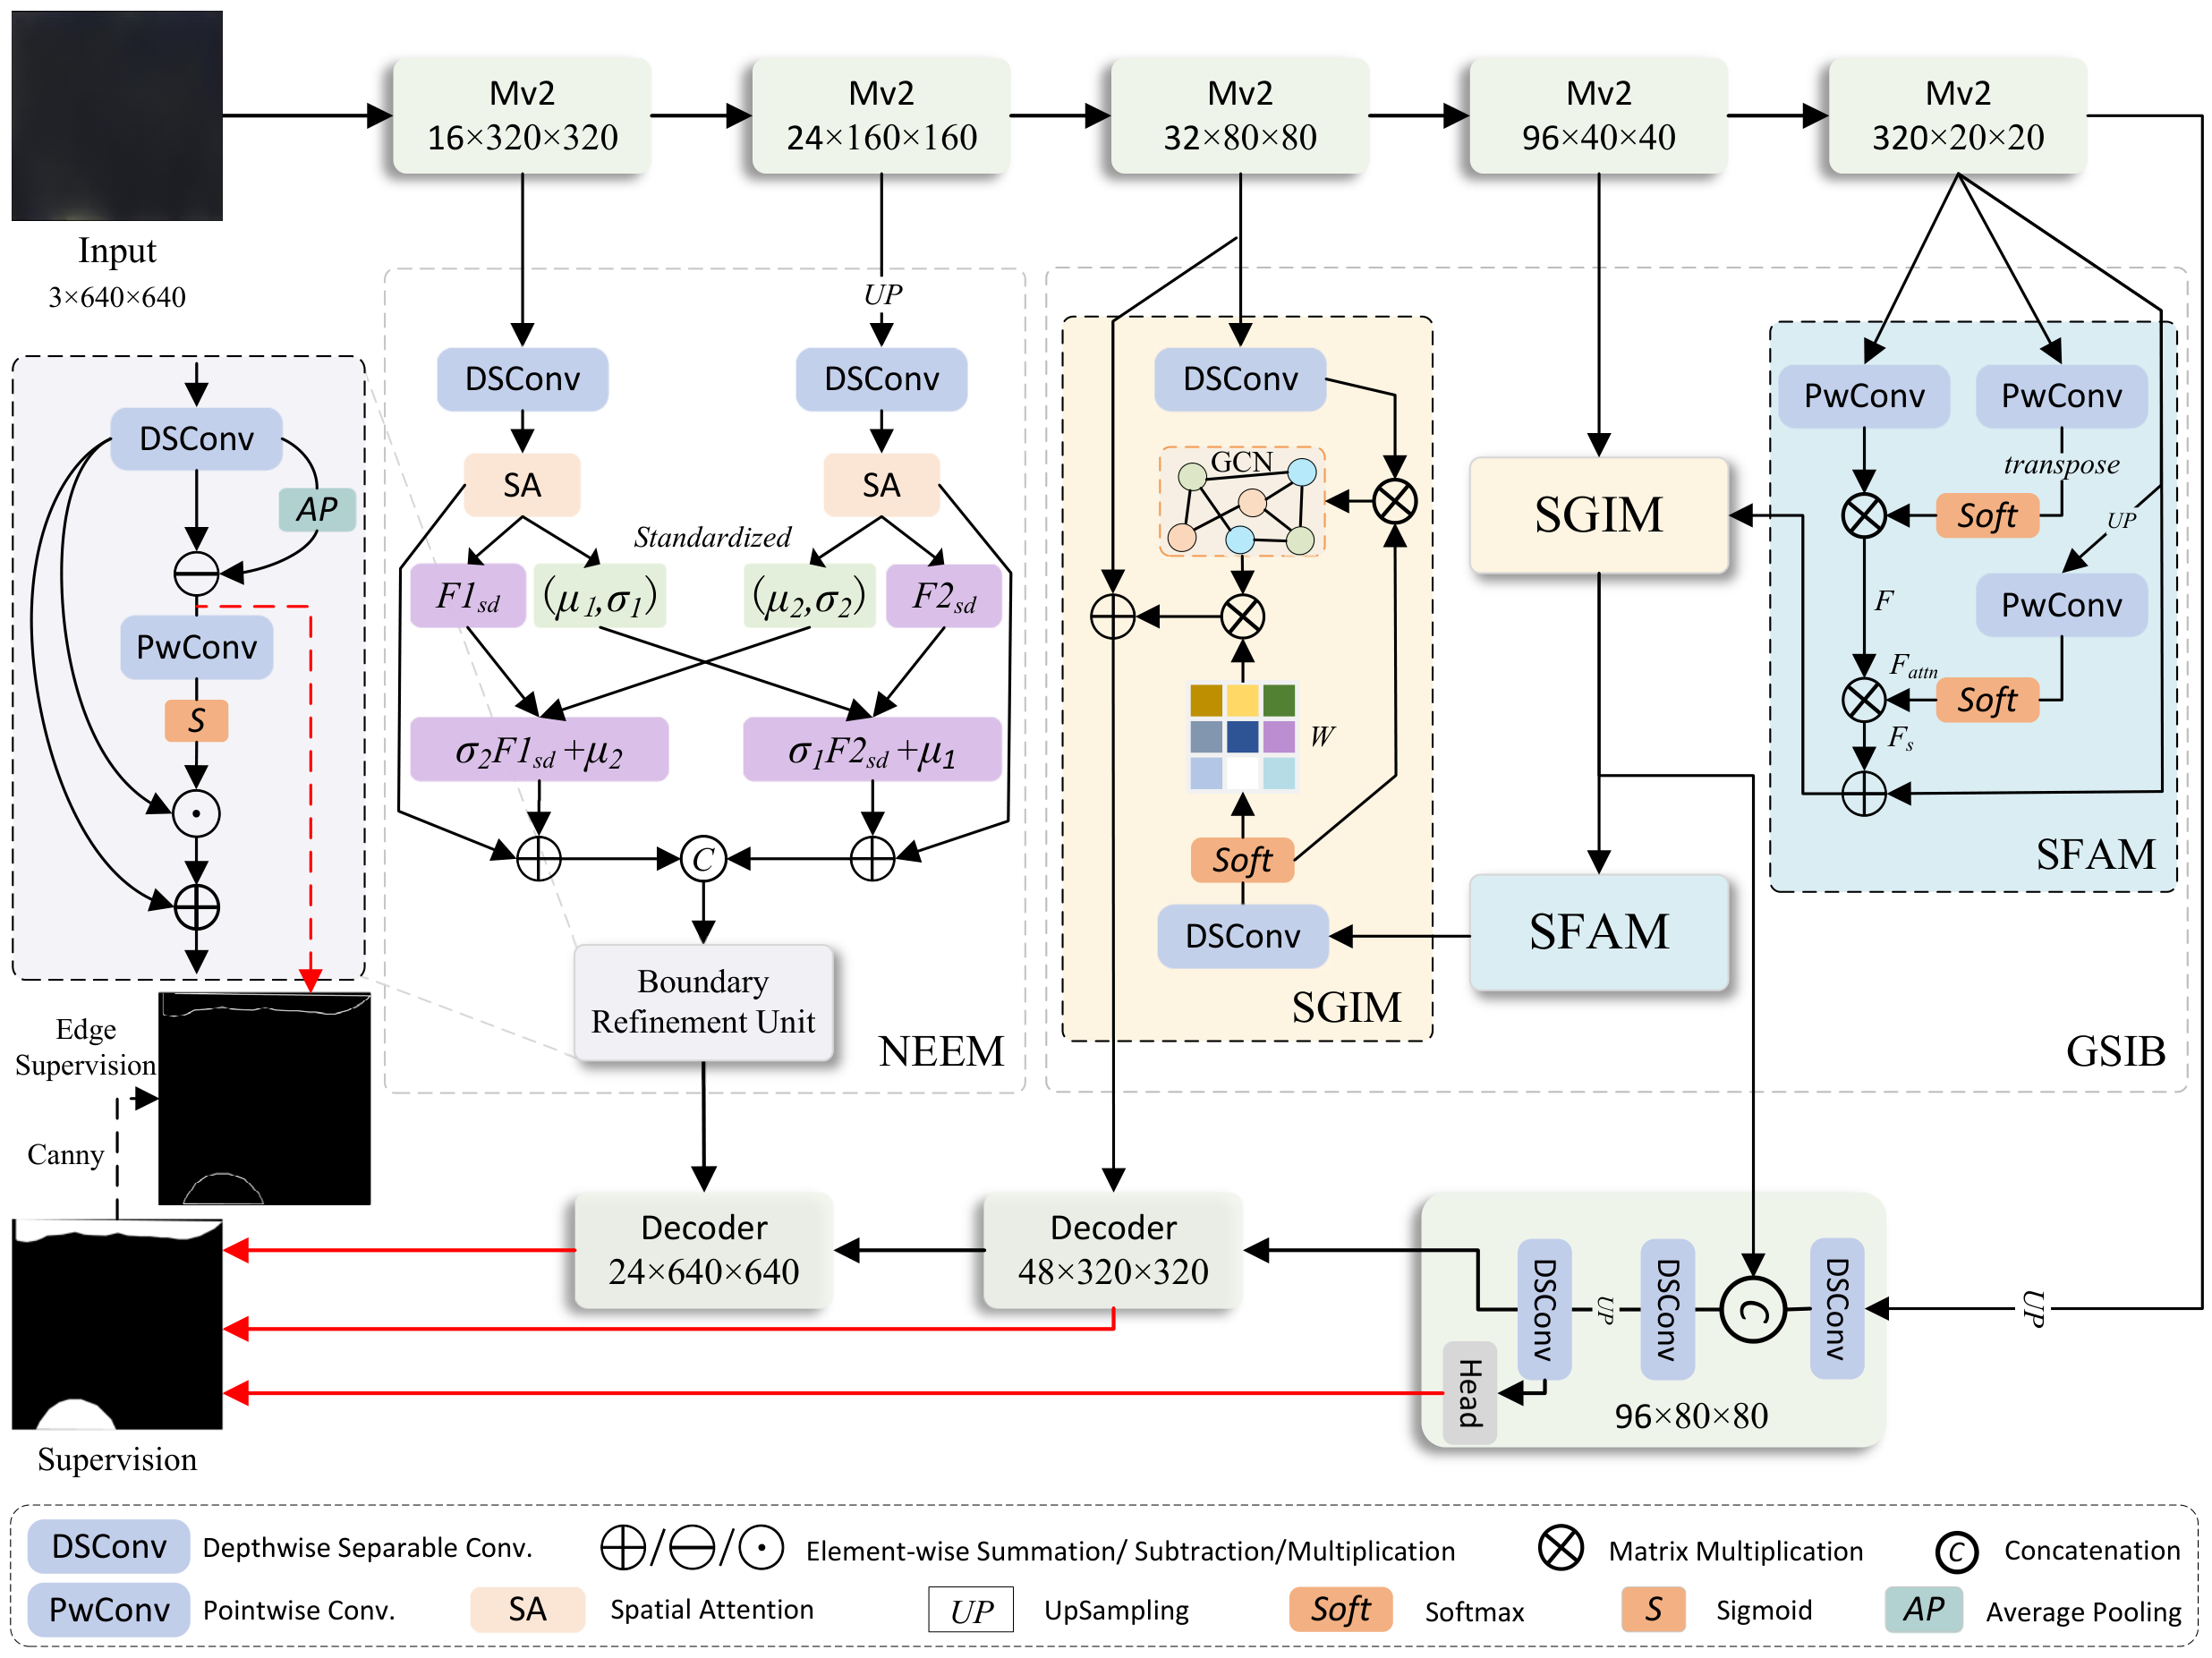
As shown in Figure 2, the proposed lightweight SIFNet is built upon a common encoder-decoder architecture [29, 30] and consists of six key components: Mv2 encoder, Graph-based Semantic Interscale-fusion Block (GSIB), Semantic Fluid Aggregation Module (SFAM), Semantic Graph Inference Module (SGIM), NeighborFusion Edge Enhancement Module (NEEM), and lightweight decoder. For the encoder of SIFNet, we adopt the lightweight MobileNet-V2 [17]. Specifically, we retain the first 17 inverted residual bottlenecks while truncating the last two convolutional layers and average pooling layer to make it suitable for Mura detects detection. We divide MobileNet-V2 into five blocks based on the first, third, sixth, 13th, and last bottlenecks. The output five-level features are denoted as , = 1,2…5, where and are , and . Next, to fuse multi high-level semantic features and model abstract semantic concepts for more precise defect localization, the features are processed by the GSIB, which integrates SFAM and SGIM to extract global contextual information and aggregate cross-scale semantics via hierarchical flow fusion and graph convolution. In addition, NEEM explores the correlation between shallow features , enhancing the model's ability to perceive fine-grained structures and represent spatial details more effectively. Furthermore, edge information is extracted using a pooling subtraction operation , and the Canny operator is applied to generate edge supervision for correcting edge errors. Finally, three decoders are employed in a progressive manner to emphasize target objects and restore resolution.
Mura defects typically exhibit large-area distribution, accompanied by uneven brightness variations and blurred boundaries, making precise segmentation challenging. To address these issues, we propose the Graph-based Semantic Interscale Fusion Block (GSIB), which integrates high-level semantic information across spatial scales and efficiently extracts semantic cues from the spatial context. By combining graph-based modeling with a soft attention mechanism, GSIB excels at capturing long-range dependencies and maintaining global semantic consistency. It effectively activates high-level features in potential defect regions and enhances synergy between spatial location and semantic representation, enabling accurate modeling of global feature relationships within Mura-affected areas. GSIB improves the model's ability to perceive large-scale brightness gradients while maintaining low computational complexity and parameter overhead, achieving a strong balance between performance and efficiency. As shown in Figure 2, GSIB comprises two key components: the Semantic Fluid Aggregation Module (SFAM) and the Semantic Graph Inference Module (SGIM).
(1) Semantic Fluid Aggregation Module. SFAM employs a holistic strategy to capture global semantic features, enabling comprehensive extraction of semantic cues across the entire image. As shown in Figure 2, taking the encoder feature as an example, SFAM introduces a global attention mechanism to selectively extract visual primitives along the spatial dimension, thereby generating a semantic flow representation . Specifically, is passed through two parallel convolutional branches to produce a feature query and attention weights . The attention branch applies a softmax function to normalize the spatial dimension, resulting in a saliency distribution across the spatial domain. Finally, matrix multiplication is used to integrate the attention-guided global semantic representation, producing the semantic flow feature :
where denotes matrix multiplication. and represent two independent convolution operations, with and denoting their respective convolution parameters.
Due to the semantic gap between high-level features at different scales, direct multi-scale fusion may amplify inconsistencies between adjacent layers. To address this issue, the semantic flow is further refined using a soft attention mechanism that selectively emphasizes informative input features before passing them to the SGIM for interscale fusion. Specifically, the input feature is upsampled and processed through a convolution, followed by a softmax operation along the channel dimension, producing an -dimensional attention map , where in our experiments. Guided by this attention map, the semantic flow is adaptively integrated into the spatial domain, resulting in a semantic description map . Finally, the semantic description map is fused with the original high-level feature via element-wise addition to obtain the final output of SFAM, denoted as . The computation is formally defined as:
where denotes the upsampling operation, and represents the convolution.
In summary, SFAM effectively enhances global context understanding by integrating semantic flow with high-level features, while the use of soft attention helps bridge the semantic gap between features at different scales, providing a solid foundation for subsequent feature fusion in SGIM.
(2) Semantic graph-inference module. When dealing with complex Mura defect regions, traditional feature fusion methods often struggle to effectively capture the diversity of brightness variations and the inherent structural ambiguity. Therefore, we propose the Semantic Graph Inference Module (SGIM), which introduces an efficient graph-based feature aggregation mechanism to integrate receptive field information across multiple feature levels. Specifically, SGIM constructs high-order interscale relationships within the graph convolution domain, enabling explicit modeling of semantic dependencies through graph convolution operations. For Mura defects with smooth brightness transitions and blurred boundaries, SGIM effectively captures global brightness variation patterns across spatial regions, significantly improving both detection accuracy and robustness. Additionally, SGIM employs depthwise separable convolution blocks to reduce computational overhead. The detailed architecture is illustrated in Figure 2.
Taking the example shown in Figure 2, the SFAM output feature and encoder feature are first processed through two learnable linear mapping functions, and , producing spatially aligned feature sequences and , respectively: .
Next, a softmax function is then applied to to generate the attention map : .
The attention map is then multiplied with , and the resulting features are fed into a Graph Convolutional Network (GCN) [39] to learn high-order semantic relationships among regions (sets of pixels with similar features). To reconstruct the graph domain features back into their original structural features, the inner product of GCN() is computed and transformed back into a 2D image feature map with the same dimensions as the original features using a linear mapping function . Finally, the reconstructed features are then combined with feature to produce the final output of SGIM, , which is then passed to SFAM (if present) and the decoder. Notably, the number of nodes in the GCN is set to 16.
Shallow features contain rich texture details and edge information, which are critical for accurately delineating Mura defect boundaries, but they also introduce considerable background noise. Moreover, Mura defects typically exhibit gradual brightness transitions characterized by smooth intensity variations and indistinct boundaries without clear geometric structures. These features pose significant challenges for most existing defect detection methods. Since Mura defects typically exhibit gradual brightness transitions, their smooth intensity changes and blurred boundary characteristics often lack discernible geometric structures, making such regions particularly challenging for most methods to handle effectively. Thus, we propose the NeighborFusion Edge Enhancement Module (NEEM), which is designed to capture spatial correlations across multilevel features and enhance the model's sensitivity to boundary features in regions with uneven brightness. This enables more accurate identification of Mura defects in complex display environments. Additionally, NEEM is lightweight and computationally efficient, providing a practical solution for large-area Mura defect detection. The specific implementation details are illustrated in Figure 2.
First, the encoder features and are spatially aligned through upsampling. Depthwise separable convolutions (DSConv) are then applied to adjust their channel dimensions to match those of , with spatial attention independently applied to each feature to enhance detail representation and prepare for subsequent fusion. The resulting feature maps are denoted as and .
To facilitate information interaction between different feature levels, CrossNorm [40] is employed to compute and exchange the mean and variance of and , enabling structured context transfer and improving the perception of fine-grained structures. Finally, the two refined features are fused via concatenation, and a residual connection is introduced to generate the final enhanced representation, improving the consistency of edge depiction and semantic expression. This process can be expressed as follows:
where indicates channel-wise concatenation.
Next, a boundary enhancement module is applied to further refine the representation of edge features in Mura defect regions, generating the NEEM output , which is subsequently passed to the decoder. This process is defined as follows:
where denotes the activation function, and represents element-wise addition.
Mura defects often exhibit diverse scales and brightness variations across different regions of a display, necessitating precise feature fusion at multiple levels. Therefore, we introduce a lightweight multi-scale decoder that adaptively integrates hierarchical features while progressively restoring spatial resolution. This approach enables accurate detection of Mura defects across varying scales, ensuring reliable localization and classification of both small, subtle imperfections and large-area brightness non-uniformities. Each decoder follows a consistent architecture, as illustrated in Figure 2. Specifically, each decoder sequentially consists of a DSConv layer, a Concate layer (if present, to merge NEEM or SGIM outputs), another DSConv layer, an upsampling layer, a final DSConv layer, and a Head layer. The final DSConv layer provides the decoder's output for the next stage, while the Head layer generates the prediction output for deep supervision. Specifically, the Head layer consists of a dropout layer and a convolutional layer, which generate three saliency maps with different resolutions: , , and . The first two are used for deep supervision, while the last serves as the final output of SIFNet.
After obtaining the saliency maps and the edge prediction map , we train our SIFNet using a combination of BCE loss and IoU loss [33]. Therefore, our total loss consists of two parts, that is, the saliency loss and the edge loss. Moreover, we introduce a loss weight to balance the two losses, enabling more effective training. The total loss function can be formulated as follows:
where and represent the BCE loss and IoU loss, respectively, which are used to supervise with the ground truth . denotes the edge supervision map, generated from using the Canny operator.
Implementation Details. We use MobileNetV2 as the encoder, pre-trained on the ImageNet dataset , and the other modules are randomly initialized. For training and testing, all input images are resized to 640640, and random flipping and rotation are applied to augment the training data. We use Adam as the optimizer, with the learning rate initialized to 1e-4 and then scaled down by 10 every 30 epochs. Our model is trained end-to-end using PyTorch on an NVIDIA A100-SXM for 100 epochs with a batch size of 8.
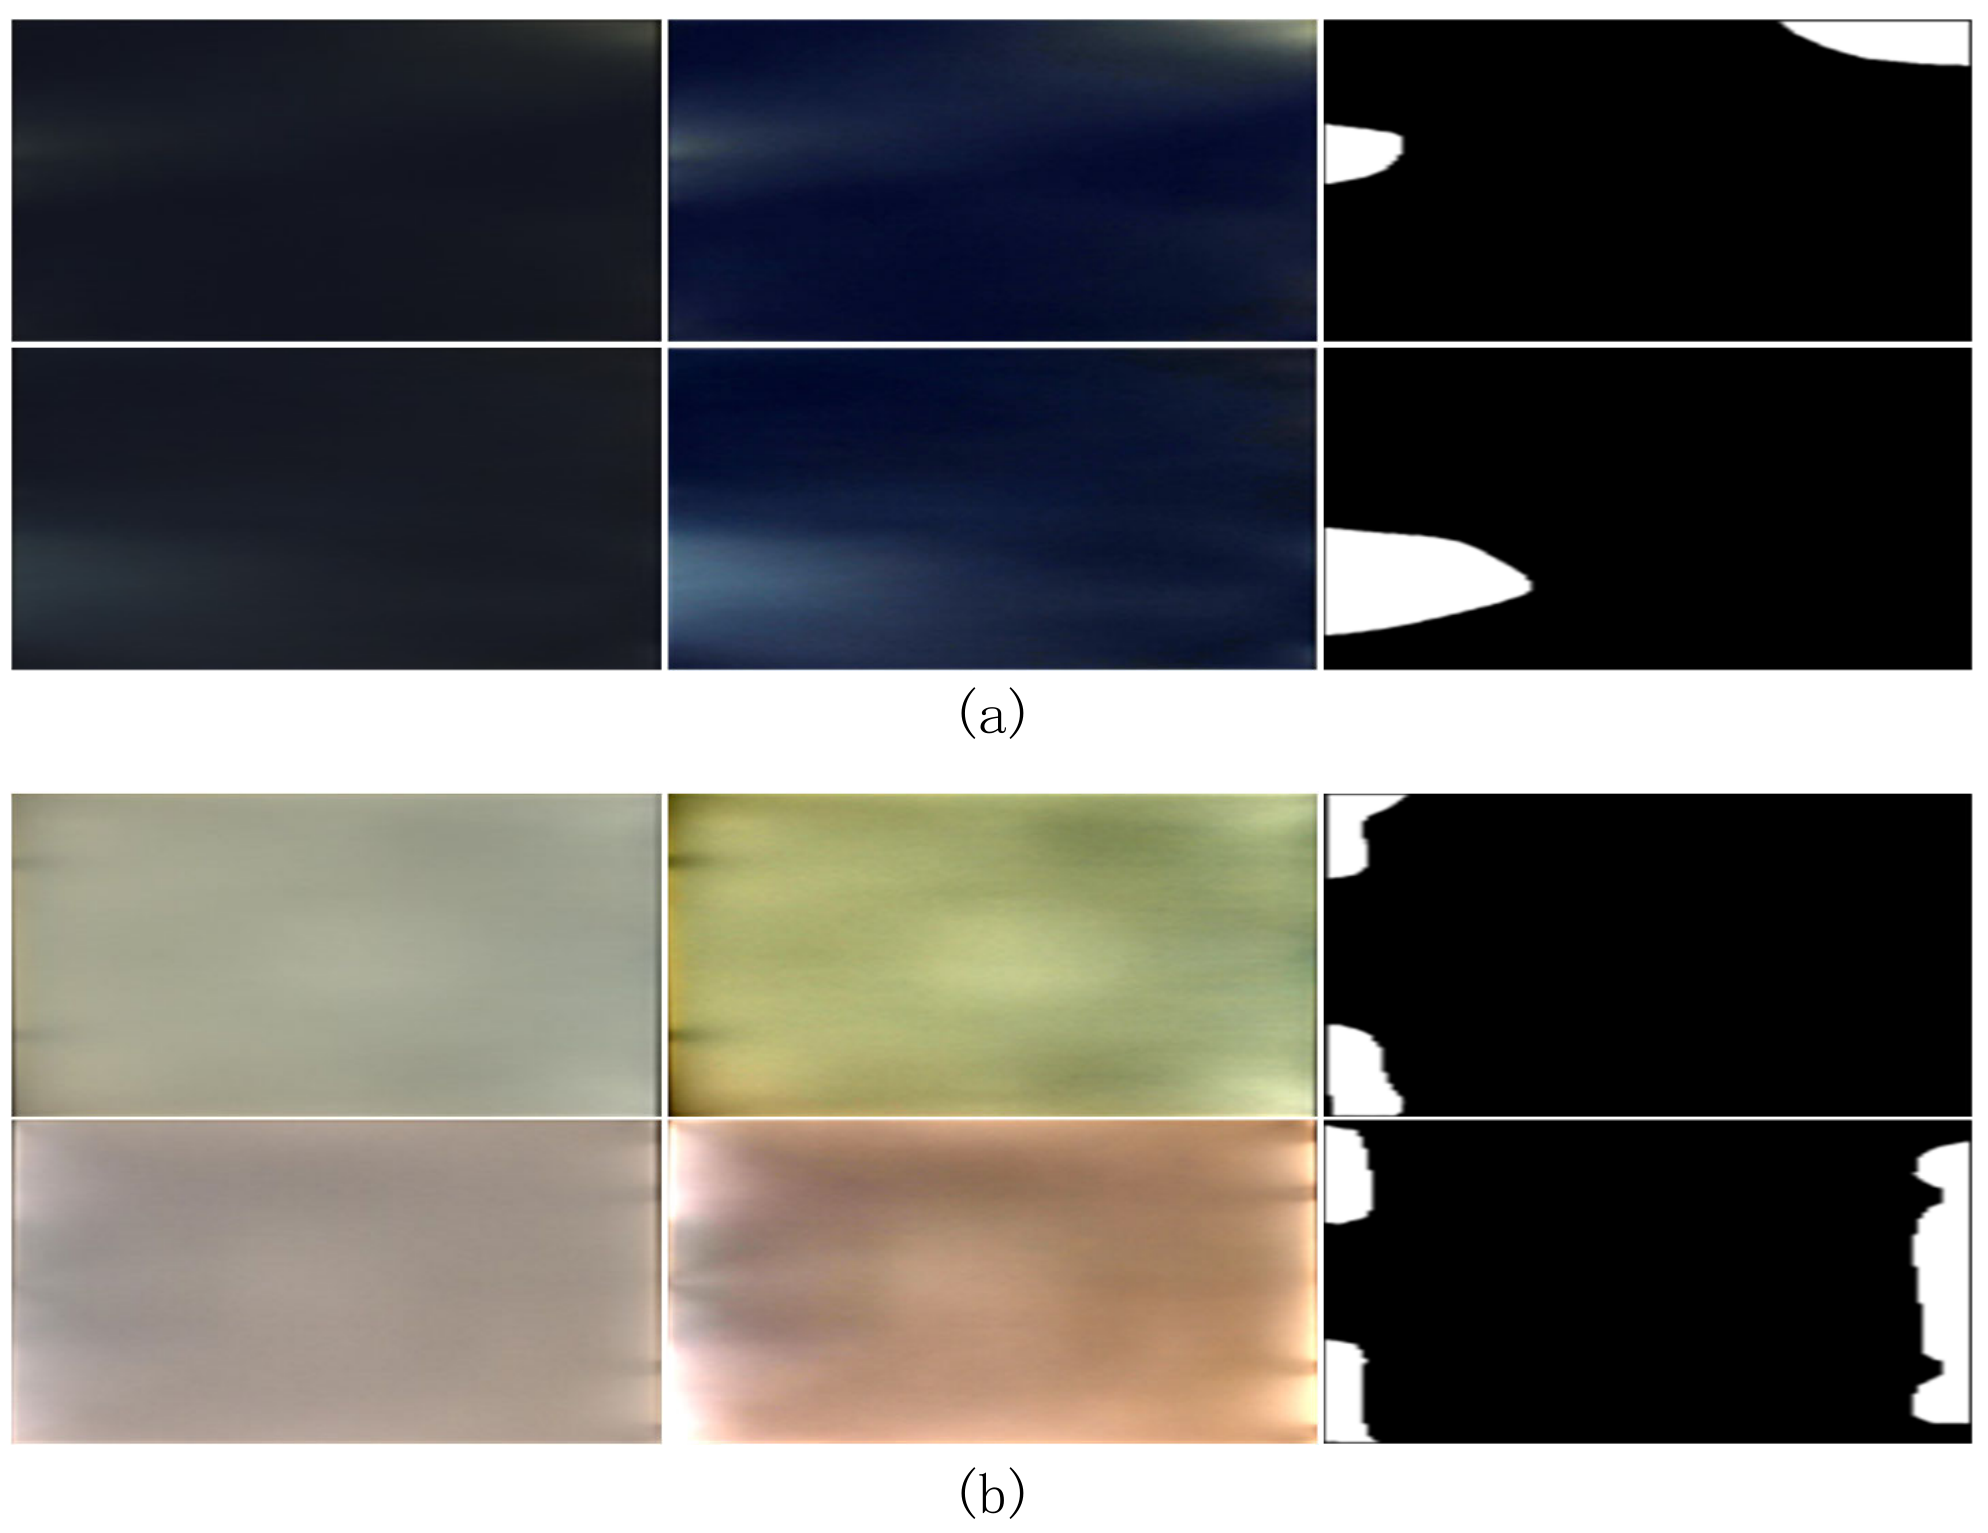
Datasets. Given the limited availability of Mura defect samples from display screens, we have constructed three specialized datasets for Mura defect detection: the black screen scenario (Uneven_Black), the white screen scenario (Uneven_White), and a mixed black-and-white screen scenario (Uneven_Mix). All images have a resolution of 36121358 pixels. The Uneven_Black dataset consists of 350 images exhibiting uneven displays on a black background, with 245 images allocated for training and 105 for testing. The Uneven_White dataset also comprises 350 images captured on a white background, following the same training/testing split. The Uneven_Mix dataset combines scenes from both black and white backgrounds, comprising 700 images in total, with 490 used for training and 210 for testing. Representative image samples are illustrated in Figure 3.
Evaluation Metrics. To comprehensively evaluate the performance of the model, we performed an extensive evaluation from both the object-level and pixel-level perspectives. The details of these evaluation metrics are as follows:
(1) Object-level:
Precision and Recall. In object detection, precision refers to the proportion of correctly predicted positive samples among all samples predicted as positive, while recall represents the proportion of correctly predicted positive samples among all actual positive samples. They are defined as follows:
where TP (True Positive) refers to correctly detected objects, FP (False Positive) denotes incorrectly identified objects, and FN (False Negative) indicates actual objects that were missed by the model.
(2) Pixel-level:
Precision and Recall. In pixel-level detection, precision is defined as the ratio of correctly predicted regions to the total predicted regions, while recall is defined as the ratio of correctly predicted regions to the total ground truth regions. The formal definitions are as follows:
where represents the predicted object region by the model and denotes the ground truth object region.
S-measure[35] is used to evaluate region-aware() and object-aware() structural similarity between predictions and GT and defined as:
where is set to 0.5.
F-measure[36] is a holistic metric that considers both precision (P) and recall (R), which is defined as:
where is the balance parameter and is set as 0.3.
E-measure[37] is used to measure pixel-level matching and image-level statistics, which is defined as:
where denotes the enhanced-alignment matrix and N is the total pixels of the image.
Mean absolute error[38] is to calculate the average absolute error of the prediction of salient objects (P) and ground truth (G), which is defined as:
We conducted a systematic comparative analysis of recent visual models that have shown strong performance in object detection and instance segmentation tasks. In this study, we selected five representative versions from the YOLO series: YOLOv7 [26], YOLOv8 [16], YOLOv9 [27], YOLOv10 [28], and YOLOv11 [15] as our research targets. These models are built on advanced deep learning architectures and significantly improve detection accuracy and segmentation quality while maintaining high real-time performance. They have been widely applied in industrial settings and defect detection tasks, especially in scenarios that require both speed and precision, such as display panel inspection and surface quality analysis. We carried out a comprehensive evaluation of these models across several aspects, including object-level and pixel-level performance, computational efficiency, and generalization ability.
Quantitative Results. Tables 1, 2, and 3 summarize the quantitative results of our proposed method and competing methods on the three challenging large-area Mura defect datasets. As can be seen from the results:
On the Uneven_Black dataset (Table 1), our method achieves the highest scores in all object-level and pixel-level metrics. It outperforms all baseline models with a precision of 0.839 and a recall of 0.865 at the object level, and leads in pixel-level evaluation with strong results in structural similarity, alignment quality, and minimal error (M = 0.067). These results highlight our model's superior ability to detect Mura defects under low-contrast, dark background conditions.
On the Uneven_White dataset (Table 2), our method again delivers the best overall performance. It achieves the highest object-level precision and recall (0.912 and 0.906, respectively) and leads in key pixel-level metrics such as F-measure ( = 0.626). Our method also attains a very low error rate (M = 0.029), confirming its robustness in handling subtle defects under high-brightness settings.
On the Uneven_Mix dataset (Table 3), which combines both dark and bright regions, our model consistently achieves top performance. It records the highest object-level precision (0.859) and recall (0.823), and outperforms all baselines across pixel-level metrics. These results demonstrate that the proposed SIFNet not only performs well on specialized datasets, but also generalizes effectively to more diverse and complex industrial defect scenarios.
| Methods | #Param | FLOPs | Object-level | Pixel-level | ||||||
|---|---|---|---|---|---|---|---|---|---|---|
| (M) | (G) | P | R | P | R | M | ||||
| YOLOv7 | 37.8 | 141.9 | 0.789 | 0.665 | 0.779 | 0.576 | 0.692 | 0.815 | 0.690 | 0.074 |
| YOLOv8 | 11.7 | 42.7 | 0.783 | 0.605 | 0.787 | 0.497 | 0.663 | 0.782 | 0.645 | 0.080 |
| YOLOv9 | 57.8 | 371.6 | 0.753 | 0.684 | 0.704 | 0.631 | 0.672 | 0.815 | 0.677 | 0.083 |
| YOLOv10 | 8.7 | 21.6 | 0.750 | 0.674 | 0.748 | 0.716 | 0.664 | 0.744 | 0.668 | 0.086 |
| YOLOv11 | 10.1 | 35.3 | 0.722 | 0.780 | 0.727 | 0.736 | 0.685 | 0.855 | 0.699 | 0.069 |
| Ours | 3.92 | 6.89 | 0.839 | 0.865 | 0.800 | 0.841 | 0.704 | 0.832 | 0.742 | 0.067 |
| Methods | #Param | FLOPs | Object-level | Pixel-level | ||||||
|---|---|---|---|---|---|---|---|---|---|---|
| (M) | (G) | P | R | P | R | M | ||||
| YOLOv7 | 37.8 | 141.9 | 0.814 | 0.809 | 0.820 | 0.755 | 0.672 | 0.578 | 0.096 | 0.043 |
| YOLOv8 | 11.7 | 42.7 | 0.891 | 0.512 | 0.876 | 0.464 | 0.781 | 0.892 | 0.456 | 0.026 |
| YOLOv9 | 57.8 | 371.6 | 0.819 | 0.823 | 0.859 | 0.804 | 0.673 | 0.569 | 0.076 | 0.043 |
| YOLOv10 | 8.7 | 21.6 | 0.856 | 0.785 | 0.811 | 0.768 | 0.738 | 0.682 | 0.087 | 0.029 |
| YOLOv11 | 10.1 | 35.3 | 0.889 | 0.548 | 0.871 | 0.725 | 0.794 | 0.904 | 0.464 | 0.024 |
| Ours | 3.92 | 6.89 | 0.912 | 0.906 | 0.895 | 0.803 | 0.890 | 0.965 | 0.626 | 0.029 |
| Methods | #Param | FLOPs | Object-level | Pixel-level | ||||||
|---|---|---|---|---|---|---|---|---|---|---|
| (M) | (G) | P | R | P | R | M | ||||
| YOLOv7 | 37.8 | 141.9 | 0.799 | 0.775 | 0.780 | 0.735 | 0.682 | 0.696 | 0.394 | 0.058 |
| YOLOv8 | 11.7 | 42.7 | 0.825 | 0.571 | 0.818 | 0.565 | 0.722 | 0.837 | 0.551 | 0.053 |
| YOLOv9 | 57.8 | 371.6 | 0.778 | 0.755 | 0.796 | 0.725 | 0.673 | 0.693 | 0.376 | 0.063 |
| YOLOv10 | 8.7 | 21.6 | 0.807 | 0.723 | 0.782 | 0.746 | 0.691 | 0.714 | 0.412 | 0.057 |
| YOLOv11 | 10.1 | 35.3 | 0.787 | 0.735 | 0.821 | 0.731 | 0.740 | 0.879 | 0.581 | 0.047 |
| Ours | 3.92 | 6.89 | 0.859 | 0.823 | 0.824 | 0.831 | 0.803 | 0.902 | 0.632 | 0.042 |
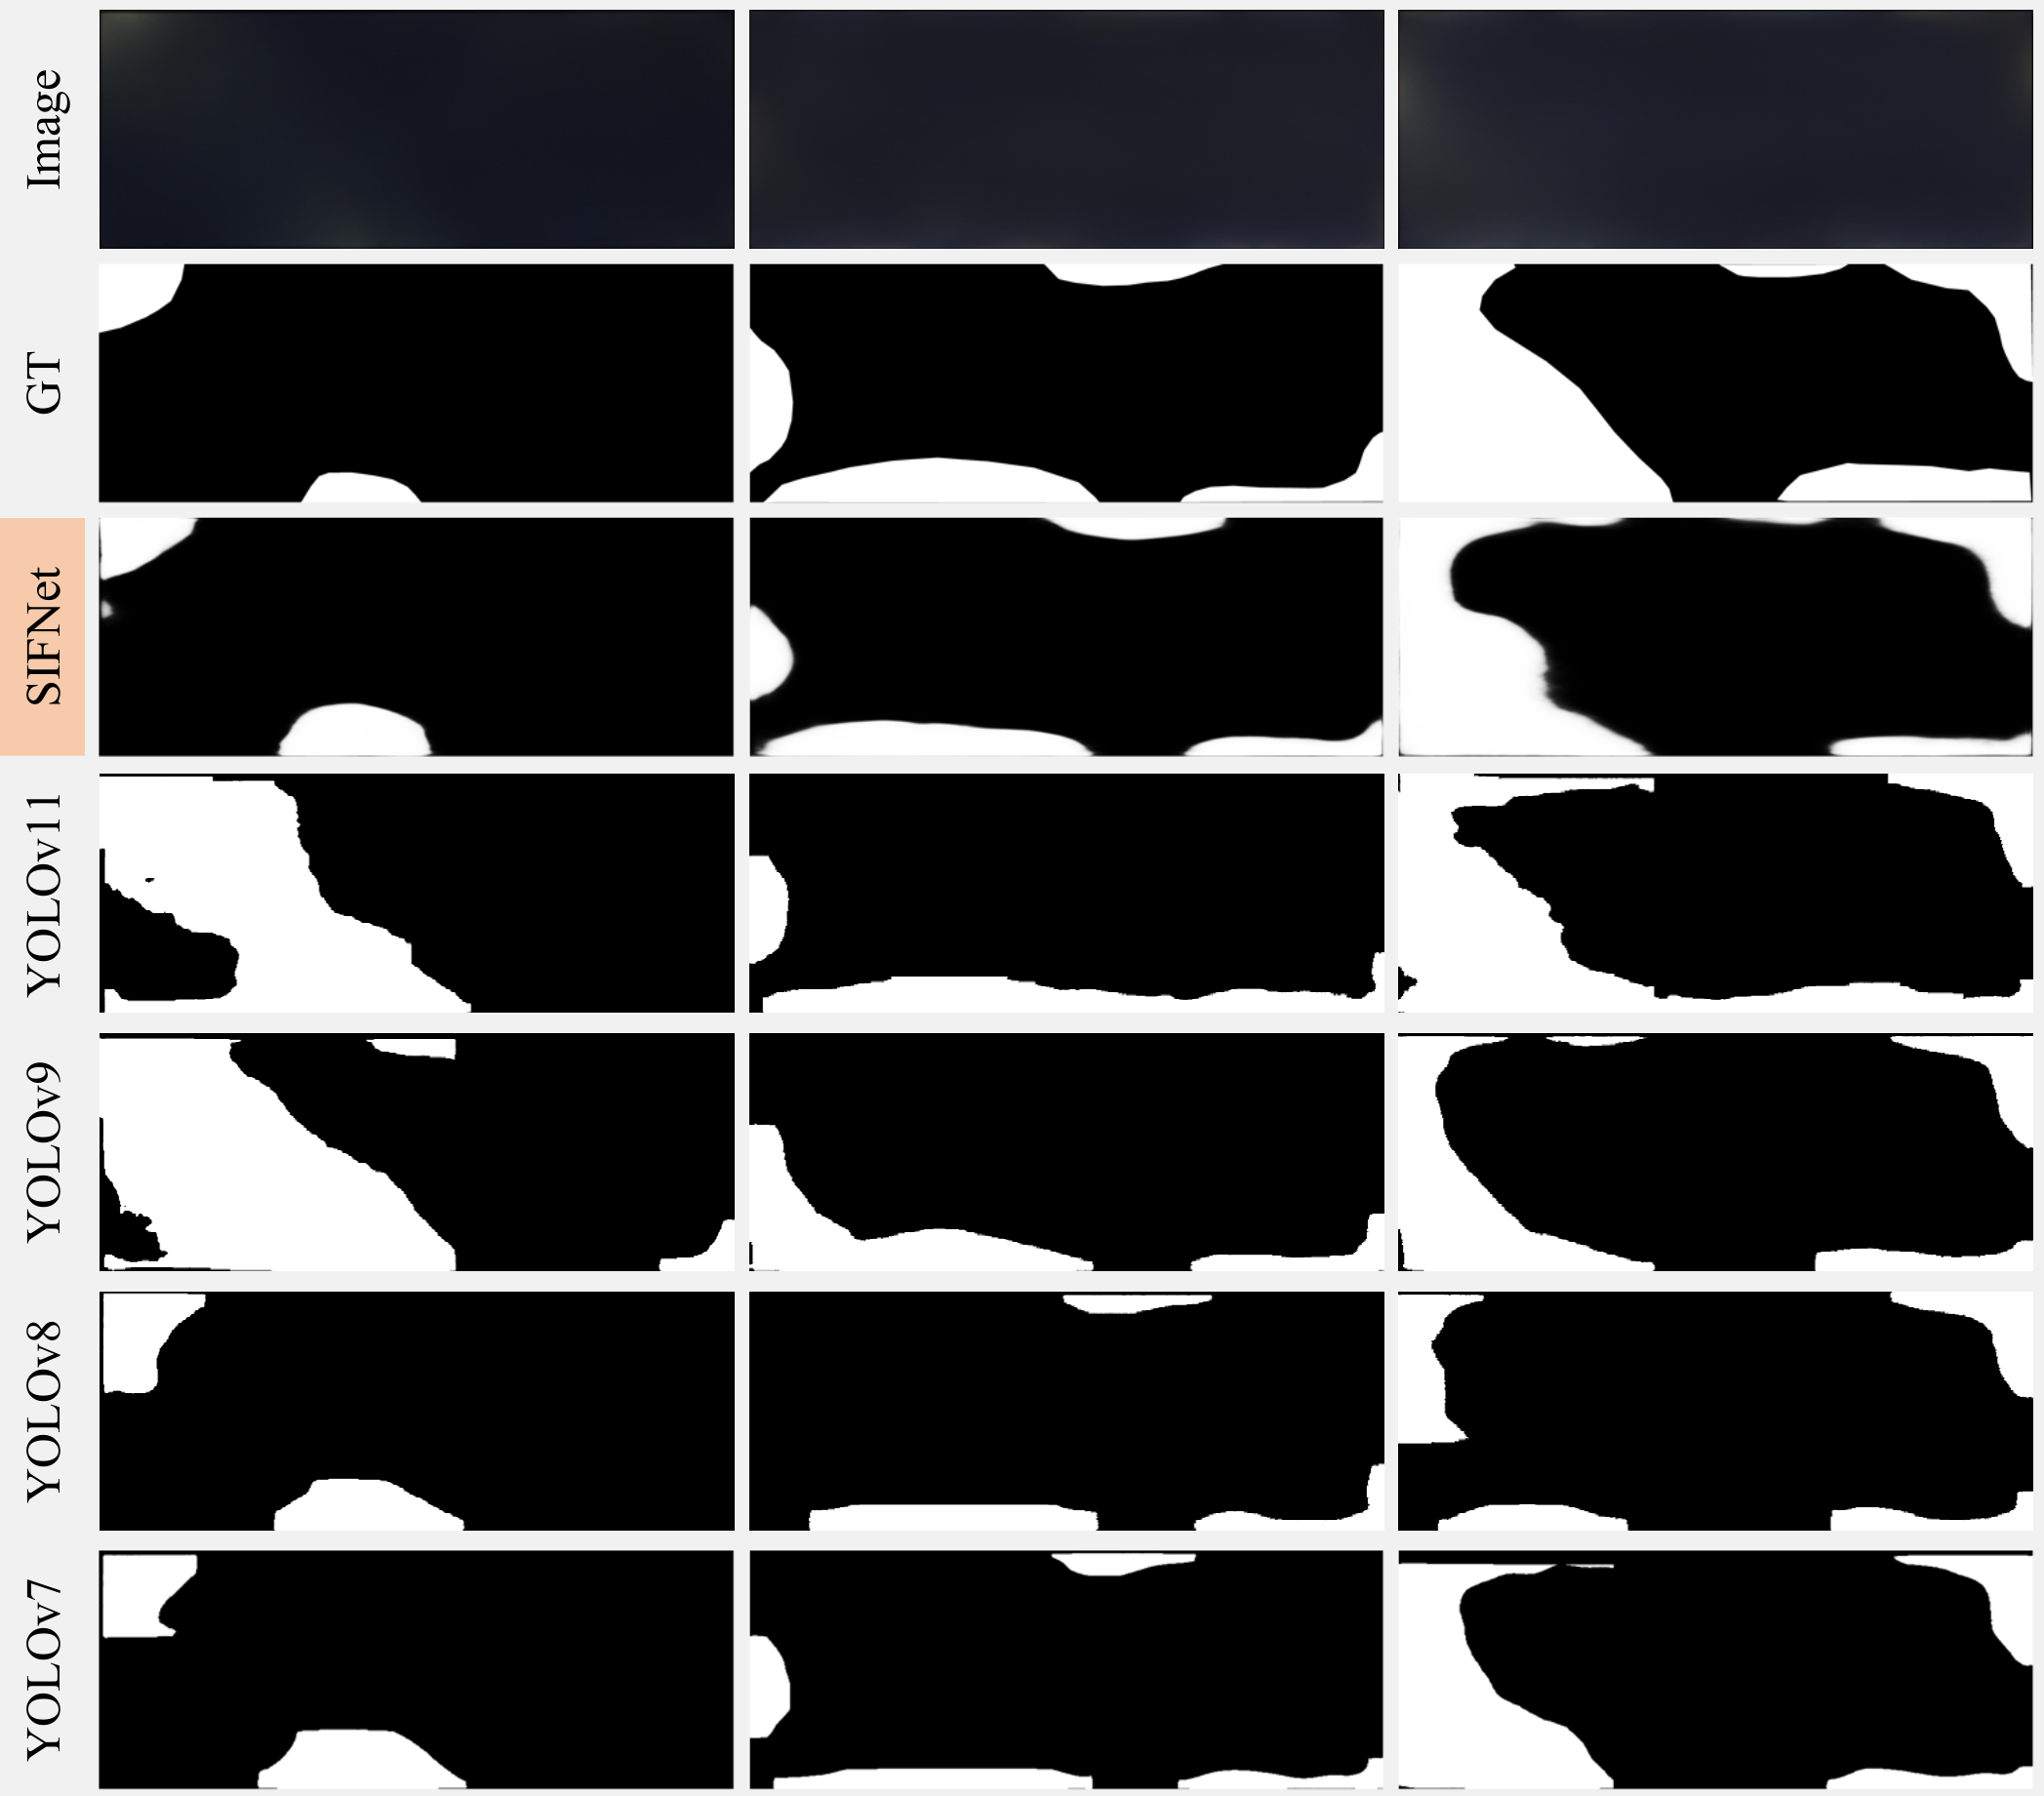
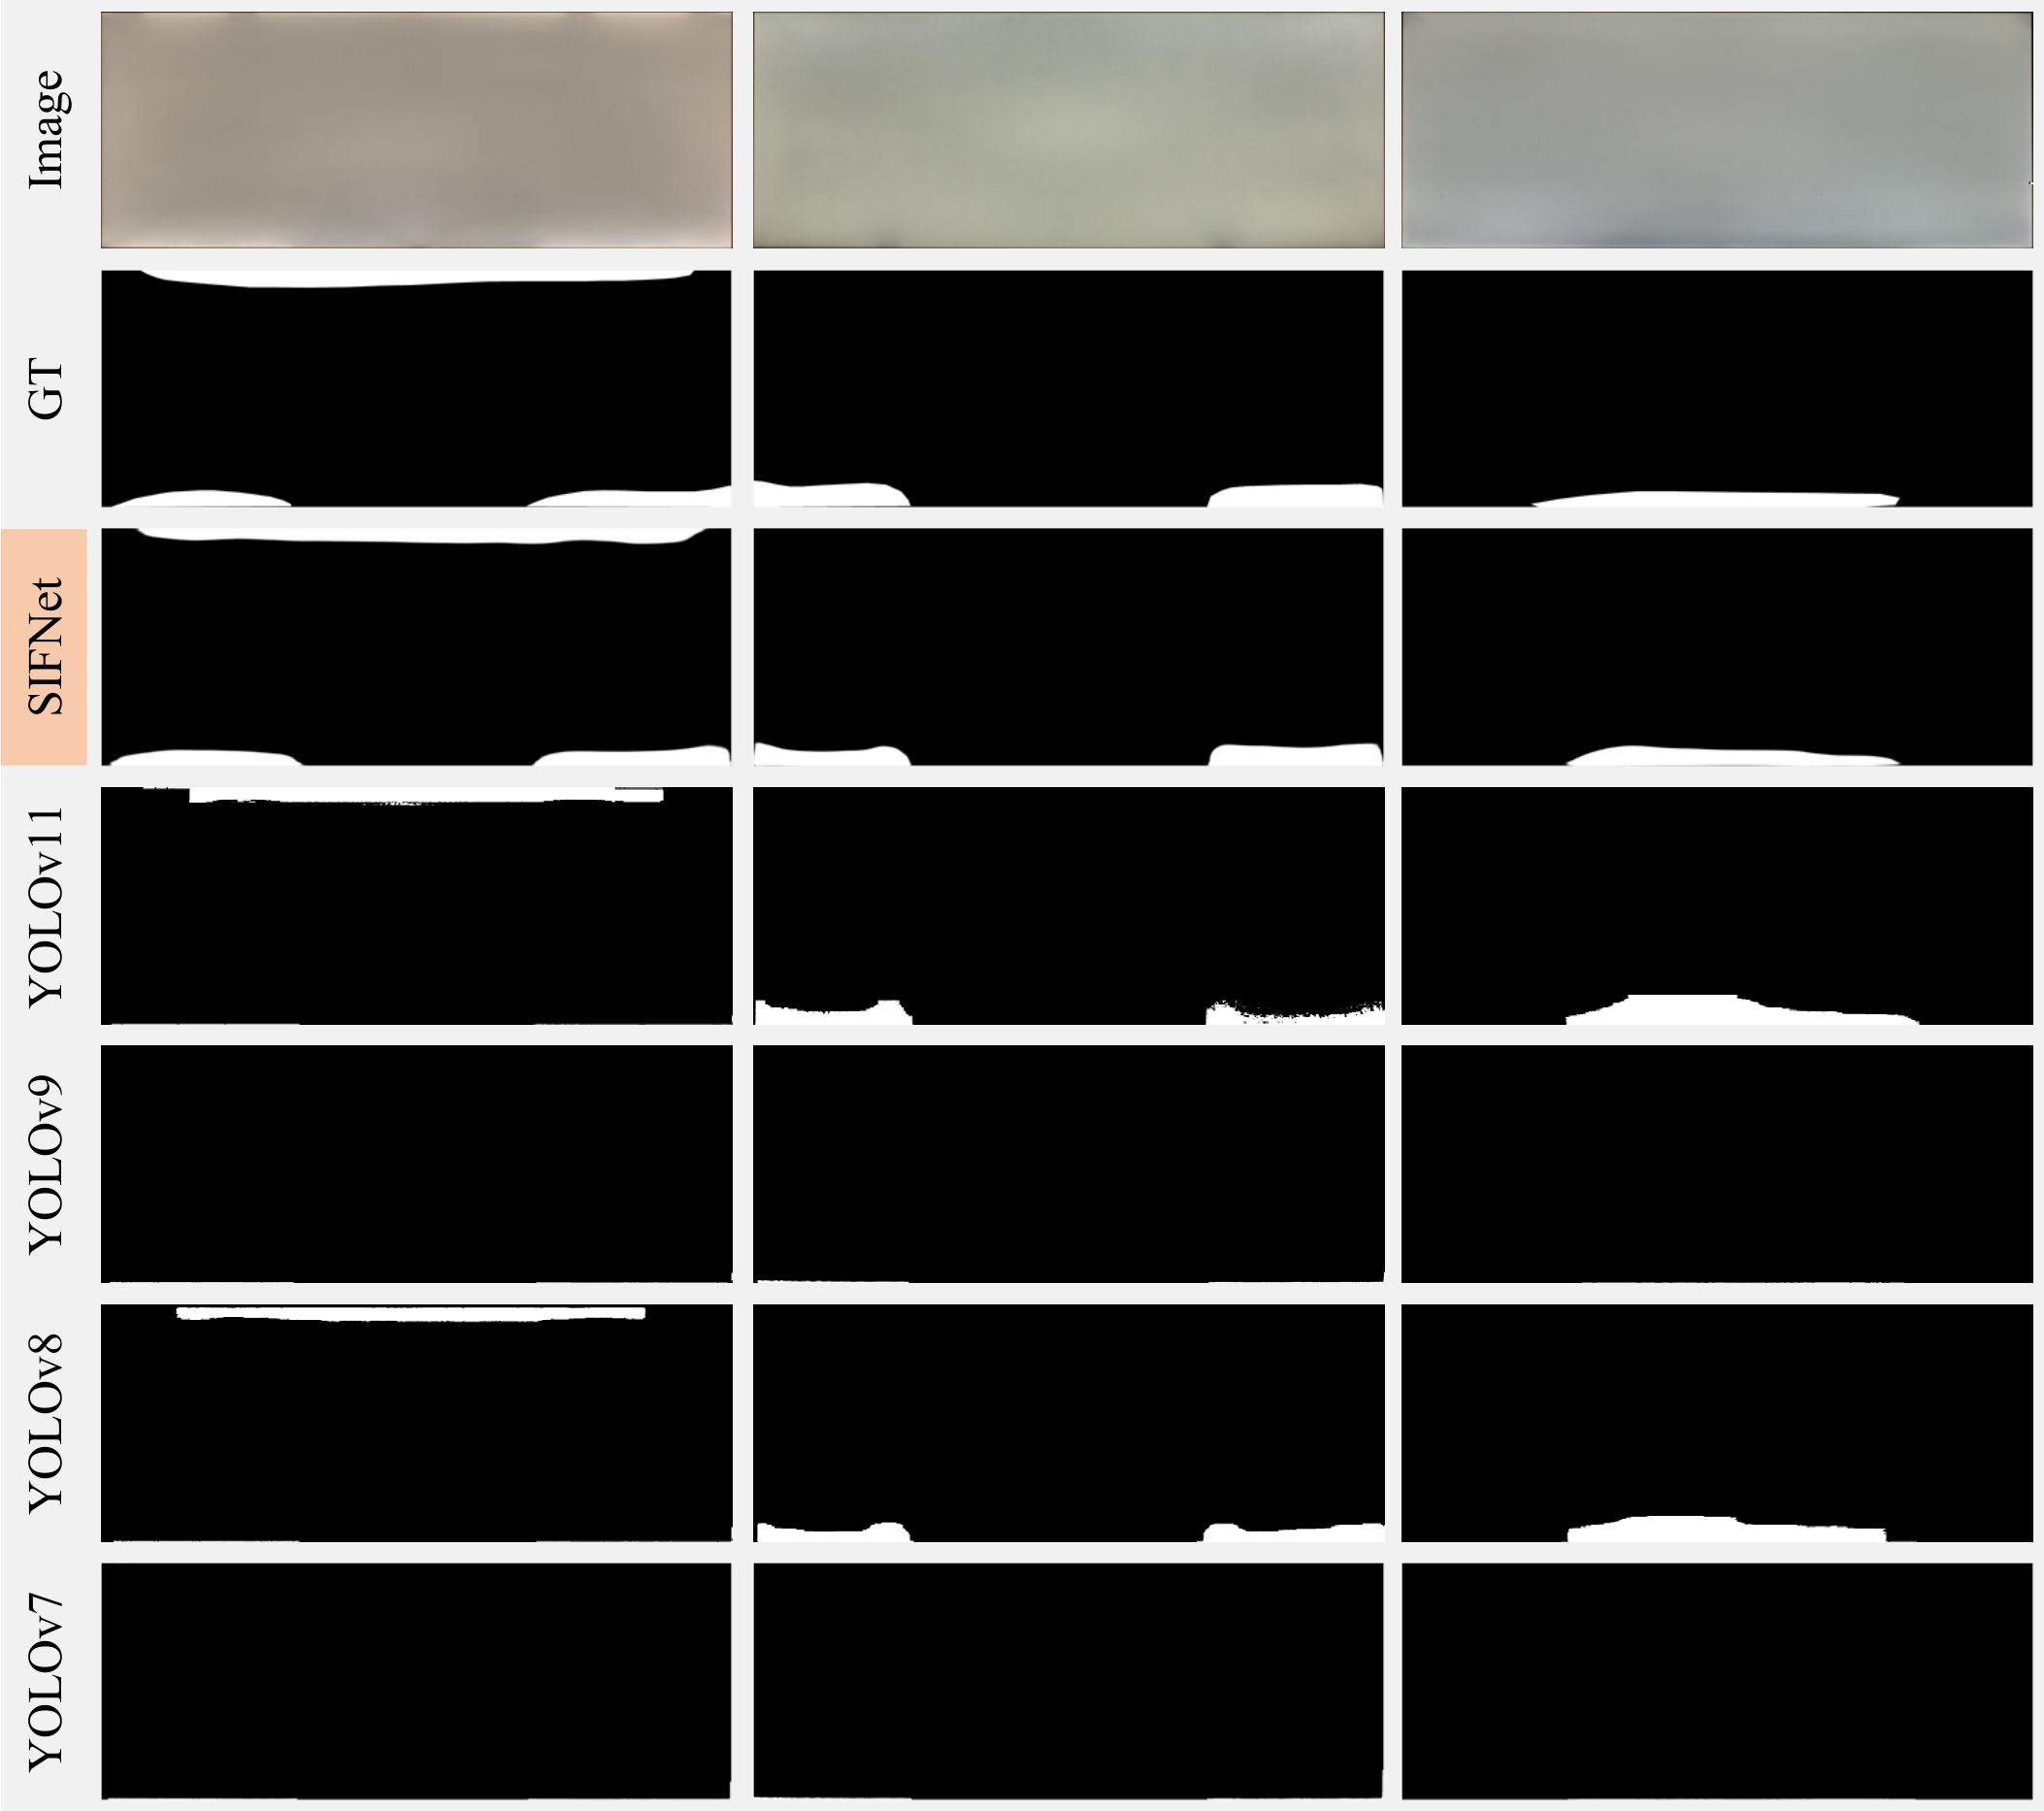
Qualitative results. In the Mura defect detection task, accurately segmenting defective regions is critical for improving quality control in display panel manufacturing. Figures 4 and 5 illustrate the detection results under two different background conditions (black screen and white screen), comparing various methods. As can be seen from the results:
| Methods | FPS | #Param | FLOPs | Object-level | Pixel-level | ||||||
|---|---|---|---|---|---|---|---|---|---|---|---|
| (M) | (G) | P | R | P | R | M | |||||
| No.1 | 61 | 2.355 | 2.58 | 0.794 | 0.773 | 0.761 | 0.777 | 0.740 | 0.840 | 0.561 | 0.112 |
| No.2 | 57 | 2.781 | 3.46 | 0.818 | 0.792 | 0.789 | 0.791 | 0.766 | 0.887 | 0.592 | 0.083 |
| No.3 | 50 | 3.567 | 5.97 | 0.831 | 0.804 | 0.802 | 0.811 | 0.782 | 0.908 | 0.611 | 0.059 |
| No.4 | 45 | 3.922 | 6.89 | 0.859 | 0.823 | 0.824 | 0.831 | 0.803 | 0.902 | 0.632 | 0.042 |
| Datasets | P | R | ||||||||
|---|---|---|---|---|---|---|---|---|---|---|
| Uneven_Black | 0.800 | 0.841 | 0.704 | 0.832 | 0.742 | 0.852 | 0.748 | 0.846 | 0.748 | 0.067 |
| Black_aug | 0.851 | 0.961 | 0.875 | 0.976 | 0.901 | 0.984 | 0.924 | 0.987 | 0.903 | 0.010 |
Under the black screen scenario, YOLOv11 and YOLOv7 generally capture the overall shape of the defects but suffer from boundary inaccuracies and occasional over- or under-segmentation. YOLOv8 and YOLOv10 perform less effectively, producing coarser segmentations and distorted defect shapes. In particular, YOLOv11 is prone to false positives, often misclassifying background artifacts as defects. On the contrast, SIFNet exhibits a strong ability to delineate defect boundaries and closely reconstruct the true shapes of the defective areas. Its predictions are highly consistent with the GT, characterized by smooth contours and precise coverage.
Under the white screen scenario, the reduced contrast between defects and background makes detection more challenging. SIFNet continues to perform reliably, producing accurate results that closely align with the ground truth and effectively retain fine boundary details. In comparison, the competitors show reduced performance: YOLOv11 and YOLOv8 often yield blurrier edges and miss subtle defect regions, while YOLOv9 and YOLOv10 exhibit more pronounced issues, such as false positives, incomplete segmentation, and disrupted boundaries, indicating limited generalization and detail preservation under complex scenarios.
Overall, unlike other methods that exhibit inconsistent performance across different background scenarios, SIFNet demonstrates consistently strong results, accurately capturing Mura defect features with strong robustness.
To analyze the contribution of each lightweight module in our approach to Mura defect detection, we evaluate four variants of the model: No.1. Baseline (consists of the MobileNetV2 backbone and our lightweight decoder); No.2. Baseline + NEEM; No.3. Baseline + GSIB; No.4. Baseline + NEEM + GSIB (our final model). The quantitative results and computational complexity on the Uneven_Mix dataset are summarized in Table 4. As shown, each module contributes positively to the overall performance of the model in detecting Mura defects. The baseline model (No.1), which consists of a MobileNetV2 backbone and a lightweight decoder, achieves a reasonable balance between speed and accuracy. However, introducing NEEM (No.2) results in improved pixel-level performance, especially in the score (0.887) and object-level precision (0.818), confirming the effectiveness of NEEM in refining local defect boundaries. However, the GSIB-enhanced model (No.3) offers even greater improvements in both object-level (precision: 0.831, recall: 0.804) and pixel-level (: 0.908, recall: 0.611) performance, highlighting its capability to capture large-scale brightness inconsistencies. Finally, the integrated model (No.4), combining both NEEM and GSIB, achieves the best performance across almost all metrics, including the highest object-level precision (0.859) and recall (0.823), highest pixel-level precision (0.824) and (0.632), and the lowest mean absolute error (M = 0.042). These results confirm the complementary strengths of the two modules: GSIB enhances global context awareness, while NEEM improves fine-grained boundary localization. Their integration leads to a robust and accurate Mura defect detection framework, demonstrating the effectiveness of our modular design.
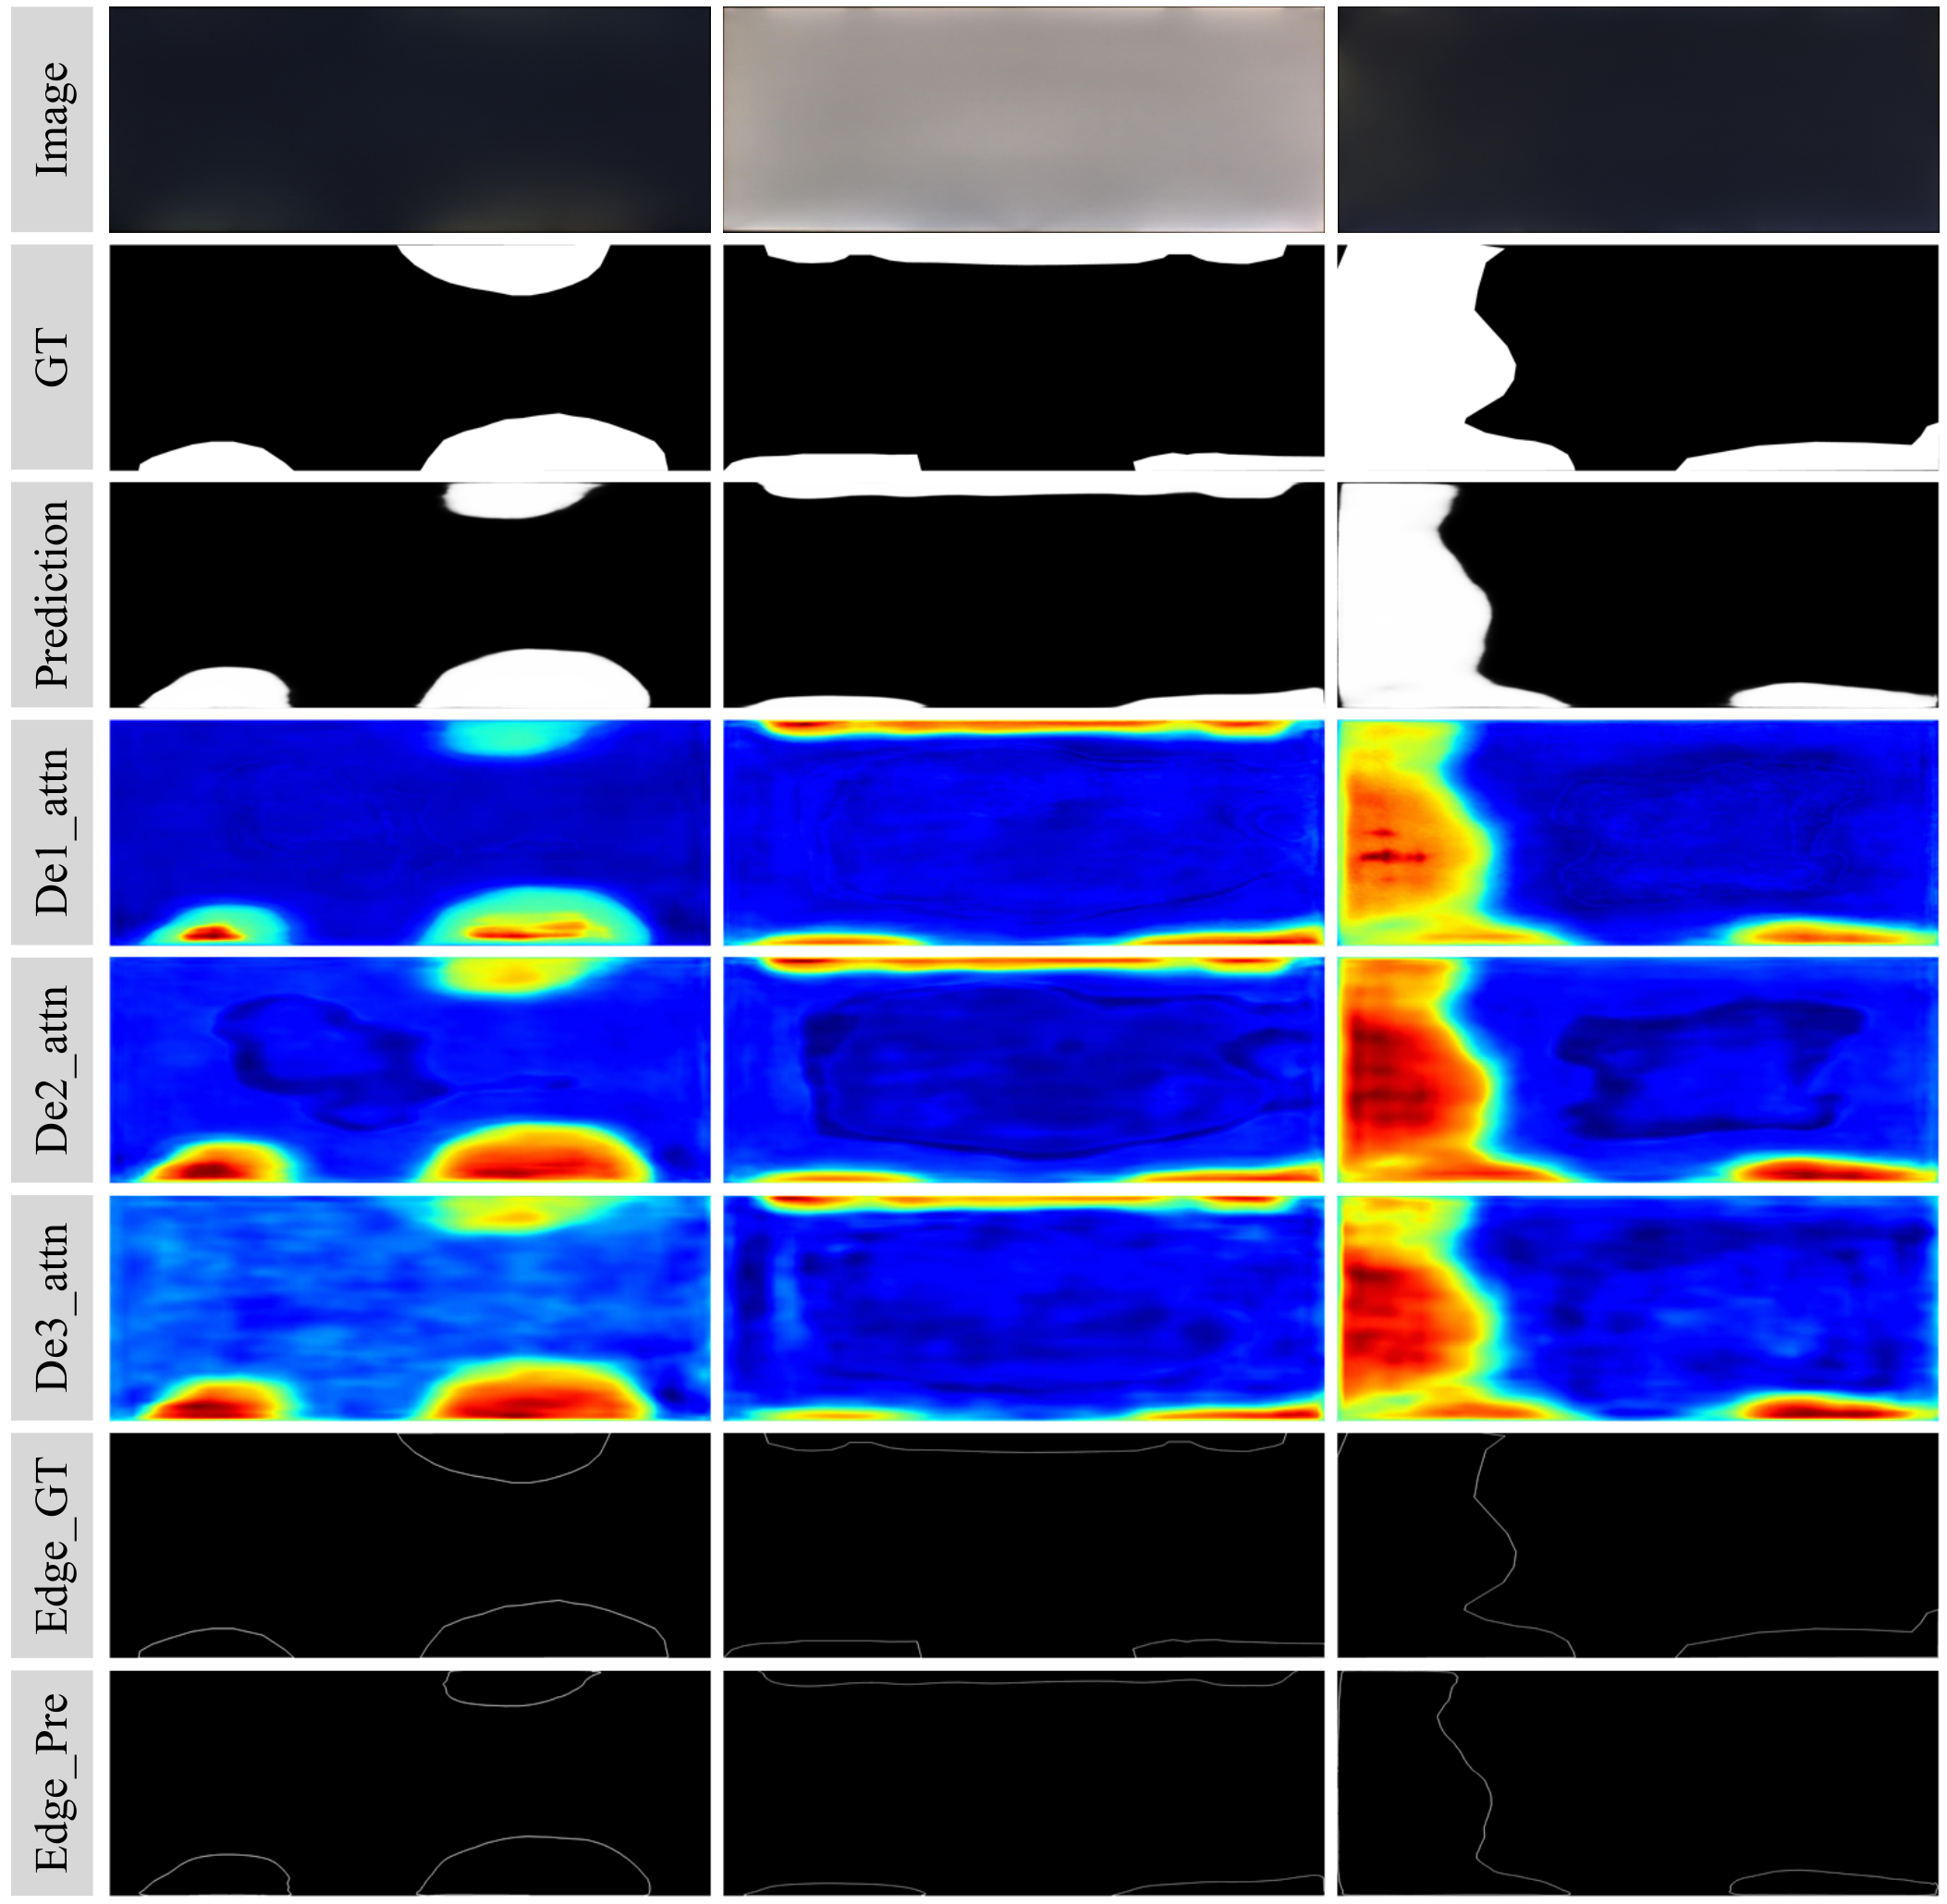
Figure 6 illustrates the comprehensive visual analysis of the proposed method across various Mura defect scenarios. From top to bottom, the rows correspond to the original input images, ground truth (GT) segmentation masks, predicted segmentation outputs (Prediction), attention activation maps from three decoders (De1_attn, De2_attn, De3_attn), ground truth edge maps (Edge_GT), and the corresponding predicted edges (Edge_Pre). The segmentation results demonstrate high consistency with the ground truth, indicating the model's strong capability in accurately localizing Mura defects across different background conditions and defect morphologies. The attention maps reveal a progressive refinement of spatial focus through the decoder hierarchy, with deeper stages (De2 and De3) exhibiting enhanced sensitivity to defect contours and intensity transitions. Furthermore, the predicted edge maps show a close correspondence to the ground truth boundaries, validating the efficacy of the proposed edge-guided refinement strategy in enhancing boundary localization accuracy. Collectively, these visualizations substantiate the effectiveness of our attention-enhanced multi-stage decoder and edge-aware learning framework in achieving fine-grained, structurally coherent Mura defect segmentation.
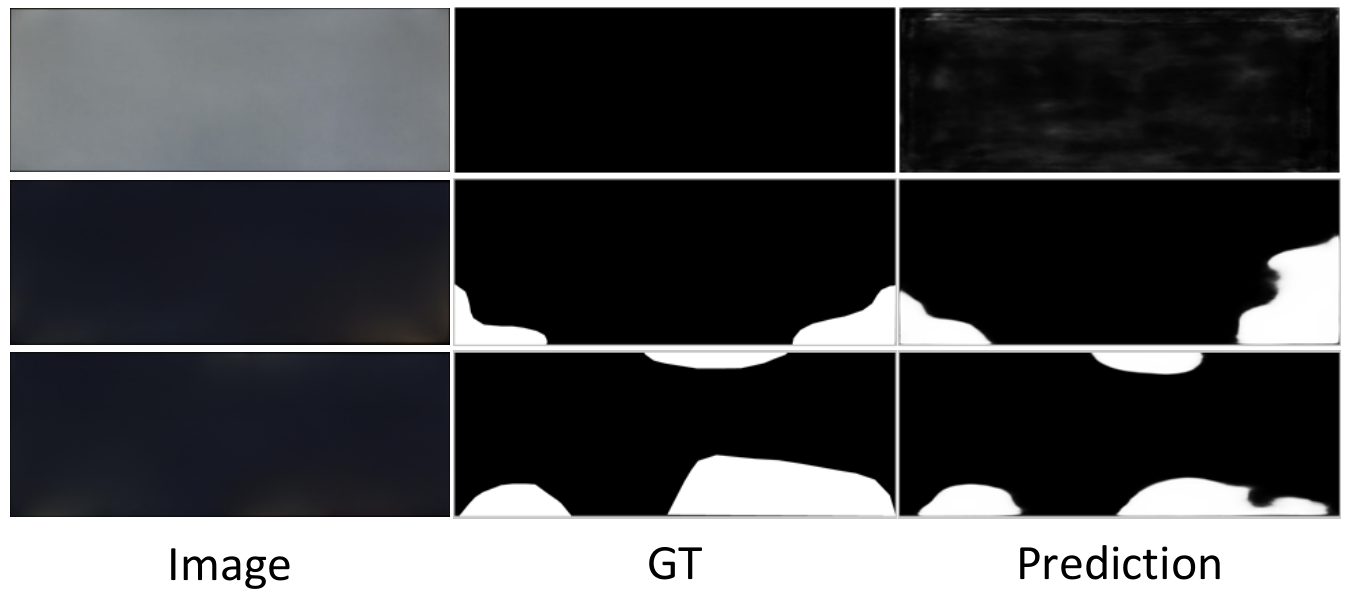
Although our model outperforms state-of-the-art (SOTA) methods in both qualitative and quantitative evaluations, several cases where detection results are less satisfactory are illustrated in Figure 7. Specifically, the first row presents a smooth image without visible defects, consistent with the ground truth. However, the prediction map exhibits some uncertain responses, suggesting that the model may be less reliable in defect-free white screen scenarios. This limitation could potentially be addressed by expanding the annotated white screen dataset. In the second row, slight defects are present and correctly labeled in the ground truth. The model detects part of the defective area but does not achieve full coverage. The third row shows clear defects, which the model identifies well, closely matching the ground truth, although minor omissions or over-detections remain. Enhancing image contrast may help highlight Mura regions and further improve detection accuracy. Moreover, Table 5 compares the performance of SIFNet on the original Uneven_Black dataset versus the augmented Black dataset (Black_aug; 1,500 images), reporting improvements across all evaluated metrics: Precision (P), Recall (R), S-measure (), mean F-measure (), mean E-measure (), max F-measure (), max E-measure (), adaptive F-measure (), adaptive E-measure (), and mean absolute error (M). The results demonstrate SIFNet's consistent gains on the augmented dataset while preserving computational efficiency for industrial applications.
This study proposes SIFNet, an efficient deep learning framework for detecting large-area Mura defects in industrial applications. By combining a MobileNet-V2 backbone with our novel GSIB and NEEM modules, SIFNet achieves accurate defect localization while maintaining low computational costs (3.92M parameters, 6.89 GFLOPs). Experimental results demonstrate its effectiveness in handling Mura defects with smooth gradients and blurred boundaries, making it suitable for industrial deployment. The framework provides a practical solution for quality inspection while balancing accuracy and efficiency.
 Copyright © 2025 by the Author(s). Published by Institute of Central Computation and Knowledge. This article is an open access article distributed under the terms and conditions of the Creative Commons Attribution (CC BY) license (https://creativecommons.org/licenses/by/4.0/), which permits use, sharing, adaptation, distribution and reproduction in any medium or format, as long as you give appropriate credit to the original author(s) and the source, provide a link to the Creative Commons licence, and indicate if changes were made.
 Chinese Journal of Information Fusion
ISSN: 2998-3371 (Online) | ISSN: 2998-3363 (Print)
Email: [email protected]

Portico
All published articles are preserved here permanently:
https://www.portico.org/publishers/icck/