
Journal of Social Systems and Policy Analysis
ISSN: pending (Online)
Email: [email protected]

Although transformational leadership is considered appropriate for hierarchical analysis, empirical research on its impact on employee innovation behavior and organizational innovation performance remains insufficient. Most existing studies view transformational leadership as an individual-level variable and explore its impact on organizational innovation performance, but research on the relationship between transformational leadership and organizational innovation performance at different levels is still limited. This study aims to explore the impact of transformational leadership at the individual and team level on organizational innovation performance. However, existing research is insufficient to comprehensively cover the behavioral influences and mechanisms of transformational leadership at different levels. Therefore, studying the influence of transformational leadership at different levels and its related influencing factors is still an important topic at present. The effectiveness of transformational leadership depends on the organizational environment. Research should consider the situational factors, explore the influence mechanism of transformational leadership on organizational innovation performance in the Chinese context, and study how employees complete the learning process through understanding, observing and imitating leadership behavior to stimulate self-leadership behavior.
| Researcher | Definition |
|---|---|
| Forester et al. (1978) [1] | Transformational leadership is that the leader stimulates and inspires the motivation of employees through higher ideas and moral values, so that subordinates can put power into work, and then promote subordinates to become leaders, while leaders become the driving force behind reforms. The process by which subordinates elevate each other to a higher level of needs and motivation. |
| Bass et al. (1985) [2] | Transformational leadership stimulates the high-level needs of subordinates by making employees aware of the importance of the tasks they undertake, and establishes an atmosphere of mutual trust, prompting subordinates to sacrifice their own interests for the benefit of the organization, and greatly exceeding the original expected results. |
| Yukl (1998,2002) [3, 4] | Transformational leadership refers to influencing organizational members to change their attitudes and assumptions and establishing commitment to organizational missions or goals. strategies to achieve organizational goals. |
| Sergiovanni (1990) [5] | Transformational leadership is a value-added emotional leadership that emphasizes high-level, intrinsic motivation and needs. The leader inspires members to exert their intelligence and surpass the original motivation and expectations. This kind of leadership has cultural and moral significance. |
| Leithwood (1992) [6] | Transformational leadership is the vision provided by the leader as an internal incentive, through means of sharing, investment, enthusiasm and stimulation, to improve and enhance members' ideas in the actual operation process, so that they are full of hope for the future. |
| Waddell (1996) [7] | Transformational leadership is the creation of a professional atmosphere and attitude by leaders and subordinates. Through professional development, decision-making sharing, and self-worth improvement, a growth and learning environment of respect, acceptance, friendliness, and support is created. |
| Fields et al. (1997) [8] | Transformational leadership enables subordinates to go beyond the exchange of benefits through their identification with the leader and his vision. |
| Pillai et al. (1999) [9] | Transformational leadership is when the leader stimulates the higher-level needs of the downstream, promotes the trust relationship of the organization, and makes the subordinates construct the organization's interests above their own interests, so as to promote the subordinates to perform beyond expectations. |
| Wilmore et al. (2001) [10] | Transformational leadership is a collaborative, decision-sharing orientation that emphasizes the development and empowerment of professional competencies, understanding change and encouraging members to make change. |
| Ackoff (2010) [11] | Transformational leaders have charismatic traits, have special influence on followers, motivate subordinates to sacrifice their own interests for the organization, and inspire subordinates with personalized care and intelligence, so that subordinates will try their best to achieve organizational goals. |
| Yammarino et al. (2001) [12] | Transformational leadership characterizes the relationship between leaders and employees, which is a combination of leader behavior and beneficial effects on employees. Leader behaviors include articulating a vision, communicating a sense of purpose, demonstrating determination, and expressing expectations of high performance to employees. Beneficial effects on employees include the generation of confidence in the leader, the happiness of the employee, and the admiration and respect for the leader. |
| Robbins et al. (2010) [13] | Transformational leaders articulate or help articulate a vision that can be attempted, even if it is difficult to achieve, but makes it possible to achieve it by invoking striving, even temporary sacrifice, or by creating satisfaction, Fun and self-realization, he can also inspire and push people to realize this vision and ideal. |
This article aims to deconstruct the impact of transformational leadership on organizational innovation performance and provide a theoretical basis for enhancing innovation. Organizational innovation is complex, and while scholars have studied the effects of various variables on innovation performance, the combined impact trajectories are not fully understood. Therefore, this study employs statistical methods such as t-tests, ANOVA, correlation, factor, and regression analyses to identify the feedback paths within the organizational innovation system using SPSS 23.0. In a competitive economic environment, innovation is crucial for organizational development, and managers have implemented various measures to promote it. This article suggests the need for theoretical verification of these measures and further exploration of leadership behaviors and innovation networks that can stimulate employee innovation, improve organizational performance, and clarify corporate leadership strategies, management training, and cooperative innovation strategies.
The research in this article investigates the influence of educational development on the cultivation of innovative skills and the enhancement of talent. It establishes a multi-level model to explore the mechanisms that drive organizational innovation performance, focusing on the roles of individuals and the organization. The study highlights the critical role of employees, including leaders, in the innovation ecosystem, as they are the driving force behind the system's stability, circulation, and evolution. It introduces a novel analytical framework for future studies. Additionally, it offers theoretical foundations and policy suggestions for corporate entities to engage in innovation practices and for basic education departments to develop innovative talents. The outcomes of this research help us comprehend the methods by which leadership can inspire and boost employee innovation, thereby improving organizational innovation outcomes. It also identifies personal attributes that foster organizational innovation and provides theoretical backing for corporate leadership and innovation collaboration decisions, serving as a guide for other types of organizations.
Transformational leadership focuses on enhancing leadership philosophy and innovation, motivating subordinates to exceed themselves by improving their needs and intrinsic motivation, as shown in Tables 1 and 2. Transactional leadership, contrastingly, is about meeting subordinates' needs through exchanges, emphasizing a reciprocal relationship based on value exchanges. It is a short-term exchange result, as opposed to self-actualization motivation. Transactional leadership, as per Leader-Member Exchange Theory and Path-Goal Theory, clarifies job roles and rewards and punishments, based on material or economic exchanges.
Transactional leadership involves leaders affirming and rewarding hard work, meeting needs, and gaining respect from subordinates. In cases of misbehavior, leaders apply corrective punishment. Kellerman suggests that leaders and employees have an interdependent relationship, each meeting the other's needs. Leaders aim for organizational goals, while employees seek spiritual or material satisfaction. The leader's influence comes from employees perceiving their interests align with the leader's needs. Leaders control resources and allocate them in exchange for work standards and rewards. Ackoff [11] differentiate between clear, tangible exchanges, like salary increases for goal achievement, and less tangible exchanges, such as loyalty and trust. Definitions of transactional leadership vary, but some scholars describe it in the context of Chinese culture as understanding and meeting employee needs through clear roles and goals, motivating hard work.
| Researcher | Definition |
|---|---|
| Forester et al. (1978) [1] | Transactional leadership is a process in which leaders and members achieve reciprocity through negotiation. Leaders and members reach a common goal under the principle of maximum benefit and minimum loss. |
| Bass et al. (1985) [2] | Transactional leadership is the leader who clarifies the job roles of employees so that employees have a sense of direction, understands and meets the needs of employees, and motivates them to work hard. |
| Sergiovanni (1990) [5] | Transactional leadership is a type of leadership that uses barter, where leaders and subordinates take what they need through an agreement for their own interests and purposes. |
| Leithwood (1992) [6] | Transactional leadership is the application of various reward systems in the organization by leaders in exchange for the results the leaders want. |
| Pillai et al. (1999) [9] | Transactional leadership is established in the transaction process, and the leader gives rewards and feedbacks according to the efforts and performance of subordinates. |
| Robbins et al. (2001) [13] | Transactional leadership is when a leader guides or motivates subordinates by clarifying roles and job requirements, establishing goals and direction. |
Government support has an important impact on the performance of industrial innovation. In enterprise innovation, cooperative innovation plays a key role. Jung et al. [14] views that More and more enterprises join the innovation network through industrial alliance, industry-university-research cooperation and other ways, which has stimulated scholars' research interest in the innovation network and its performance. For example, Xie et al. [15] explored the relationship between enterprise innovation network characteristics and innovation performance, as well as the intermediary role of knowledge absorption ability. Dong et al. [16] empirically studied innovation performance, and found that the acquisition of tacit knowledge of organizations plays a partial intermediary role between operation ability and allocation ability and breakthrough innovation performance, and plays a complete intermediary role between planning ability and career ability and breakthrough innovation performance. At the same time, some scholars point out that many interrelated factors must be concerned with when studying innovation performance. Service et al. [17] extracted variables from a large literature and studied more than 500 direct managers of innovation. There are many factors affecting innovation, and the research perspectives of scholars also show a trend of diversification. This article uses bibliometric tools to extract keywords from relevant Chinese and international literature and summarizes the influencing factors involved in the existing literature from the individual, organization and network levels to present an overview of the research in this field.
| Factor category | Influencing factors involved |
|---|---|
| Personal level | Employee innovative behavior, job well-being, leadership style, etc. |
| Organizational level | Technological innovation ability, learning ability, knowledge transfer, knowledge acquisition ability, technological strategy, RD investment, absorptive capacity, entrepreneurial orientation, innovation diffusion, innovation atmosphere, innovation culture, etc. |
| Network level | Industry-university-research cooperation, collaborative innovation capability, network capability, network characteristics, informal network, network embeddedness, relationship quality, social capital, "small world", trust, knowledge sharing, etc. |
In the market, innovation is seen as a key to long-term efficiency. Since Schumpeter defined innovation, scholars have offered various perspectives. Smith et al. [18] views innovation performance from a technological standpoint, suggesting it's a measure of product or service differentiation. Tierney and Farmer, however, focus on product performance, considering innovation as the creation of useful new products. Chinese scholars like Wang et al. [19] have used the DEA method to quantitatively measure innovation performance, while Yeşil et al. [20] expands the concept to include a range of activities that benefit the enterprise, such as sales, competitiveness, and profit margins. Research also suggests that product and process innovation can enhance firm performance. In China, the concept of organizational performance is often compared to innovation performance, with both assessing business outcomes. Individual creativity leading to marketable products is also seen as innovation performance , as shown in Table 3.
Bass [21] suggest that effective leaders provide individualized care and motivation to subordinates, enhancing their commitment and work willingness. Transformational leadership focuses on personalized support, which helps leaders understand employees' traits and promote mutual support and communication. This approach fosters learning behaviors and improves organizational innovation performance by encouraging diverse ideas and imagination, thereby enhancing individual and overall innovation efficiency. Transformational leaders ensure organizational support for innovation, protect against risks, and maximize individual and organizational innovation outcomes.
Research on transformational leadership focuses on its impact on innovation outcomes, yet the mechanisms through which it enhances innovation performance remain unclear. Existing studies on transformational leadership, employee innovation, and organizational characteristics are disconnected, hindering a comprehensive understanding of their interactions. Crossan et al. [22] views that the nature of the relationship between leaders and employees that influences innovation at the individual level, and how these interactions lead to organizational innovation results, is not well-defined. Most studies employ static empirical methods, which can't capture the dynamic nature of innovation or the interactive feedback between variables. Point-in-time data also fails to show the evolution of organizational innovation over time.
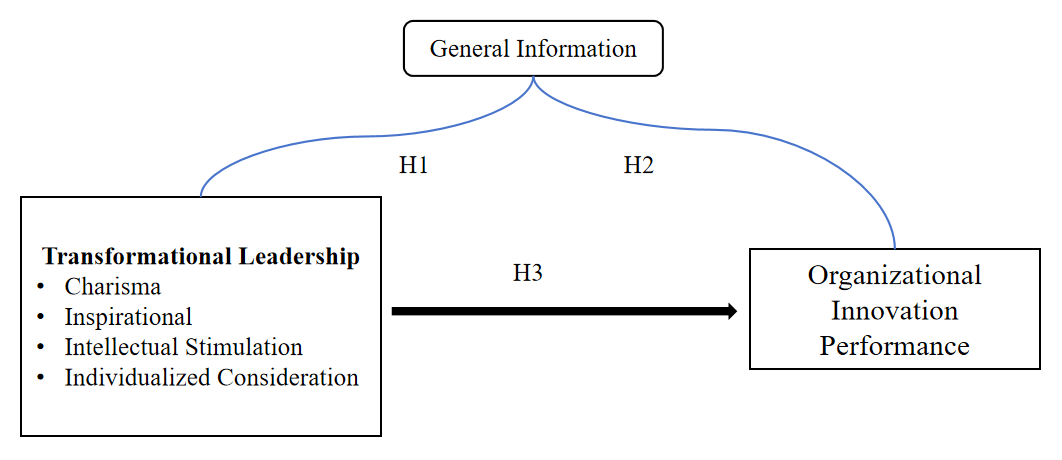
Prior studies have concentrated on specific variables related to transformational leadership and organizational innovation, enhancing our insight into particular dimensions of these concepts. However, this piecemeal approach fails to reveal the connections between these elements. To address this, the current study seeks to develop a unified analytical framework to examine the correlation between transformational leadership and organizational innovation outcomes. Building on existing literature, the research aims to delineate the interrelationships among transformational leadership, organizational innovation outcomes, and personal characteristic variables, and to construct a theoretical framework. Figure 1 shows the conceptual framework.
This study primarily employs a questionnaire survey to collect fundamental data. It constructs a highly developed scale based on a thorough analysis of pertinent variable measurement literature, as shown in Tables 4 and 5. Specifically, the scale development process references Bass et al. [2] MLQ-Form5X scale for transformational leadership and Lovelace, Lovelace et al. [23] scales for organizational innovation performance, to measure transformational leadership, organizational innovation performance, and personal trait variables.
Bass et al. [2] created the MLQ-Form5X scale to measure transformational leadership, which has four dimensions: charismatic influence, vision inspiration, individual care, and intellectual stimulation. Some works adapted these dimensions to the Chinese context, adding vision motivation, personalized care, leadership charisma, and morality. This study employs 12-item questionnaire, translated and back-translated by management and English graduate students, with expert review for clarity. The Likert-5 scale is used, with scores ranging from 1 (strongly disagree) to 5 (strongly agree).
| Variable | Item | |
|---|---|---|
| Transformational Leadership | Charisma | I make others feel happy to be with me. |
| other people trust me completely. | ||
| others are proud to work with me. | ||
| Inspirational | I use simple words to express what we can and should do. | |
| I paint an appealing vision of what we can do. | ||
| I help others find meaning in their work. | ||
| Intellectual Stimulation | I make others think about old problems in new ways. | |
| I offer others new ways of seeing confusing things. | ||
| I make other people rethink ideas they never questioned before. | ||
| Individualized Consideration | I help others develop themselves. | |
| I let people know what I think they do. | ||
| I give personal attention to those who are excluded. | ||
Combining Lovelace et al. [23] measurement indicators of organizational innovation performance, This article puts forward six items of organizational innovation performance from the aspects of organizational innovation products and patents, namely: the speed of new products, etc. Based on this, the organization's innovation performance is measured. There are 6 items in total. The specific measurement items are shown in Table 6.
| Variable | Item | |||
|---|---|---|---|---|
|
A large number of new products. | |||
| Many patent applications. | ||||
| ||||
| Products come out fast. | ||||
| High success rate of new products. | ||||
| New products are highly innovative. |
Enterprise samples need to verify the workflow of different regions, industries and nature of China. Bass et al. [2] has compiled a transformational leadership measurement tool with six dimensions and 23 questions, covering describing vision, setting role models, promoting cooperation, high expectations, individual support and intelligence. Vision is to define common goals and values; setting example is through exemplary leadership; promoting cooperation is emphasizing teamwork; high expectations are expecting members to have outstanding potential and high level of work performance; individual support is to respect the personal feelings and needs of members; and intellectual inspiration is to motivate members to think about work and seek better solutions and innovation. At the same time, a transactional leadership scale was developed, including expediency rewards and expediency penalties. The expediency reward is a timely and appropriate reward for outstanding performance; the expediency punishment is a timely and appropriate criticism or comment on the deviation and poor performance. Bass's research takes Taiwan's catering industry as a sample, and its adaptability has certain applicability under the Chinese cultural background. Kouzes et al. [24] developed the Team Leadership Practice List (LIP) as a unit of analysis, which became an effective tool for international team leadership research. The LIP includes 30 projects in five areas, involving challenging stereotypes, building consensus, mobilizing members, setting an example and stimulating enthusiasm. Effective leaders scored significantly higher than ineffective leaders in the five dimensions of LIP.
In addition to the difference research on personal traits, the four lower dimensions of transformational leadership play an important role in organizational innovation performance and are indispensable. Charismatic influence, vision motivation, talent stimulation and individual care must cooperate and coordinate with each other to realize transformational leadership affecting organizational innovation performance. In summary, This article proposes the following hypotheses:
H1: Respondents with different personal characteristics have significant differences in transformational leadership.
H1a: Gender has a significant difference on transformational leadership.
H1b: age has significant differences for transformational leadership.
H1c: education has a significant difference for transformational leadership.
H1d: Working years have significant differences for transformational leaders.
H2: Respondents with different personal characteristics have significant differences in organizational innovation performance.
H2a: Gender has a significant difference on organizational innovation performance.
H2b: Age has a significant difference on organizational innovation performance.
H2c: education has a significant difference on organizational innovation performance.
H2d: Working years have significant differences on organizational innovation performance.
H3: Transformational leadership has a significant positive impact on organizational innovation performance.
H3a: Charisma influence has a significant positive impact on organizational innovation performance.
H3b: Vision incentive has a significant positive impact on organizational innovation performance.
H3c: Talent stimulation has a significant positive impact on organizational innovation performance.
H3d: Individual care has a significant positive impact on organizational innovation performance.
The target population includes all individuals of the same nature from which researchers aim to gather information, with each individual being a population unit. A sample population is selected from this group for study. In this study, Beijing T company, with over 15,000 employees, serves as the research subject. Due to the pandemic and practical constraints, a comprehensive sampling of all employees is not feasible. Consequently, a random sampling survey method was employed. This approach involves selecting a subset of units from the target population to represent the whole, allowing for an estimation of the overall target quantity based on the sample results.
With probability-based sampling methods, the sample size can be determined through the population collection process. For example: The sample size suitable for calculation, the sample size used in the study is determined using the sample size formula, and the sample size is determined using 95% reliability and allowable value. The sampling error is 5% or 0.05. The overall sample is 5000 people. n is the number of samples used in the study, N is the size of the population, and e is the error of the random sample, which is set to 0.05. The sample size and calculation formula are as follows:
For the accuracy of the research results and the generalizability of the conclusions, this study intends to determine the sample size to be at least 390.
The survey was distributed through the online platform "Questionnaire Star", and the respondents also filled in and submitted the questionnaire through the "Questionnaire Star" platform. The duration of the questionnaire distribution is 33 days. A total of 473 questionnaires were distributed. According to the elimination of irregular answers, repeated answers and invalid questionnaires, 415 questionnaires were finally recovered, with an effective rate of 87.7%.
In order to make this study more accurate, in addition to adopting scientific and reasonable methods for the design of the questionnaire, the distribution and recovery of data, and the measurement of each research variable, it is also necessary to select appropriate analysis tools. In This article, combined with the measurement methods of various variables by researchers, tools such as descriptive statistics analysis, variance analysis, exploratory factor analysis, confirmatory factor analysis, correlation analysis, regression analysis and structural equation analysis were used. The main process is as follows: explore transformational leadership through principal component analysis, measure dimensions of organizational innovation performance, and determine the measurement dimensions of each variable; secondly, conduct descriptive statistical analysis and correlation analysis on each variable, and then explore the relationship between individual trait variables and their own The difference between the variable and the dependent variable, and based on this, the structural equation model and hierarchical regression are used to analyze the causal relationship between the variables; the main statistical tools used in This article are SPSS 22.0 and AMOS 22.0.
This study employs SPSS23.0 and AMOS 23.0 for statistical analysis, focusing on the reliability and internal consistency of the questionnaire using Cronbach's . Exploratory and confirmatory factor analyses were conducted to assess variable feasibility. Reliability, indicating the consistency of measurement results, is typically measured by the coefficient, with higher values indicating greater reliability. Devellis [25] suggests that coefficients between 0.60-0.65 should not be used, 0.65-0.70 are minimally acceptable, 0.70-0.80 are quite good, and 0.80-0.90 are very good.
| Variable |
|
Items | ||
|---|---|---|---|---|
| Charisma | 0.812 | 3 | ||
| Inspirational | 0.796 | 3 | ||
| Intellectual Stimulation | 0.801 | 3 | ||
| Individualized Consideration | 0.783 | 3 | ||
| Organizational Innovation Performance | 0.896 | 6 |
From the reliability analysis Table 7, it can be seen that the Cronbach's coefficients of the four lower-dimensional variables of change leadership are 0.812, 0.796, 0.801, and 0.783, and the Cronbach's coefficients of organizational innovation performance are 0.896. Both exceeded 0.7. It shows that the questionnaire reliability of the independent variable and the dependent variable is good, and the overall reliability of the questionnaire is high.
It can be seen from Table 8 that Bartlett =1820.998, p0.001 is obtained by performing the Bartlett sphericity test on the correlation matrix of the questionnaires, indicating that there are common factors among the questionnaires, and it is necessary to perform factor analysis on this correlation matrix; at the same time, calculate Sampling appropriateness measure KMO, the result KMO=0.829, it is suitable for factor analysis.
| Bartlett's Test for Sphericity |
|
|||||
|
|
Significant | ||||
| 1820.998 | 66 | 0 | 0.829 | |||
It can be seen from Table 9 that This article adopts the commonly used principal component analysis method and intercepts the factors with the characteristic root greater than 1 as the standard. After factor extraction of 12 items, 4 factors were finally extracted, and the 4 factors cumulatively explained 71.519% of the total variation, which could explain most of the variance.
| Extraction method: principal component analysis. | ||||||||||||||
|---|---|---|---|---|---|---|---|---|---|---|---|---|---|---|
| Component | Initial eigenvalue |
|
|
|||||||||||
| Total |
|
Cumulative% | Total |
|
Cumulative% | Total |
|
Cumulative% | ||||||
| 1 | 4.359 | 36.321 | 36.321 | 4.359 | 36.321 | 36.321 | 2.165 | 18.041 | 18.041 | |||||
| 2 | 1.758 | 14.650 | 50.971 | 1.758 | 14.650 | 50.971 | 2.152 | 17.933 | 35.974 | |||||
| 3 | 1.362 | 11.354 | 62.325 | 1.362 | 11.354 | 62.325 | 2.142 | 17.848 | 53.822 | |||||
| 4 | 1.103 | 9.193 | 71.519 | 1.103 | 9.193 | 71.519 | 2.124 | 17.697 | 71.519 | |||||
| 5 | 0.533 | 4.446 | 75.964 | |||||||||||
| 6 | 0.512 | 4.269 | 80.233 | |||||||||||
| 7 | 0.453 | 3.772 | 84.005 | |||||||||||
| 8 | 0.437 | 3.645 | 87.650 | |||||||||||
| 9 | 0.430 | 3.580 | 91.230 | |||||||||||
| 10 | 0.394 | 3.282 | 94.512 | |||||||||||
| 11 | 0.339 | 2.826 | 97.338 | |||||||||||
| 12 | 0.319 | 2.662 | 100.000 | |||||||||||
It can be seen from Table 10 that among the four extracted factors, the first factor represents intelligence stimulation, and the range of factor loading is between 0.855-0.792; the second factor represents the influence on charm, and the range of factor loading between 0.814-0.781; the third factor represents vision motivation, and the range of factor loading is between 0.831-0.795; the fourth factor represents individual care, and the range of factor loading is between 0.818-0.789. The loads of the four factors are all greater than 0.5, and the distribution of items after factor rotation is consistent with the theoretical assumptions of the questionnaire structure, so the questionnaire has good construct validity.
| Element | ||||
|---|---|---|---|---|
| 1 | 2 | 3 | 4 | |
| Intellectual Stimulation3 | 0.855 | 0.116 | 0.059 | 0.048 |
| Intellectual Stimulation2 | 0.834 | 0.078 | 0.106 | 0.110 |
| Intellectual Stimulation1 | 0.792 | 0.244 | 0.072 | 0.052 |
| Charisma2 | 0.169 | 0.814 | 0.182 | 0.170 |
| Charisma1 | 0.152 | 0.802 | 0.206 | 0.158 |
| Charisma3 | 0.146 | 0.781 | 0.154 | 0.191 |
| Inspirational2 | 0.122 | 0.172 | 0.831 | 0.153 |
| Inspirational1 | 0.072 | 0.164 | 0.804 | 0.067 |
| Inspirational3 | 0.052 | 0.167 | 0.795 | 0.198 |
| Individualized Consideration1 | 0.087 | 0.157 | 0.144 | 0.818 |
| Individualized Consideration3 | 0.063 | 0.143 | 0.129 | 0.811 |
| Individualized Consideration2 | 0.062 | 0.170 | 0.123 | 0.789 |
It can be seen from Table 11 that Bartlett =1529.792, p0.001 is obtained by performing the Bartlett sphericity test on the correlation matrix of the questionnaires, indicating that there are common factors among the questionnaires, and it is necessary to perform factor analysis on this correlation matrix; at the same time, calculate Sampling suitability measure value KMO, the result KMO=0.838, shows that it is suitable for factor analysis.
| Bartlett Sphericity Test |
|
||||
|
Freedom | Significance | |||
| 1529.792 | 15 | 0 | 0.838 | ||
It can be seen from Table 12 that This article adopts the commonly used principal component analysis method to intercept factors with the characteristic root greater than 1 as the standard. After factor extraction of 6 items, 1 factor was finally extracted, and 1 factor cumulatively explained 66.145% of the total variation, which could explain most of the variance.
| Extraction method: principal component analysis. | ||||||||||
|---|---|---|---|---|---|---|---|---|---|---|
| Component |
|
|
||||||||
| Total |
|
Cumulative% | Total |
|
Cumulative% | |||||
| 1 | 3.969 | 66.145 | 66.145 | 3.969 | 66.145 | 66.145 | ||||
| 2 | 0.692 | 11.530 | 77.676 | |||||||
| 3 | 0.466 | 7.769 | 85.445 | |||||||
| 4 | 0.401 | 6.686 | 92.131 | |||||||
| 5 | 0.333 | 5.552 | 97.682 | |||||||
| 6 | 0.139 | 2.318 | 100.000 | |||||||
From Table 13, the first factor represents the organizational innovation performance, and the factor loading ranges from 0.864 to 0.722. The loads of organizational innovation performance factors are all greater than 0.5, the distribution of items after factor rotation is consistent with the theoretical assumptions of the questionnaire structure, the questionnaire has good construct validity.
| Element | |
|---|---|
| 1 | |
| Organizational Innovation Performance2 | 0.864 |
| Organizational Innovation Performance4 | 0.836 |
| Organizational Innovation Performance3 | 0.835 |
| Organizational Innovation Performance5 | 0.818 |
| Organizational Innovation Performance6 | 0.797 |
| Organizational Innovation Performance1 | 0.722 |
This study adopts the method of random sampling questionnaire survey, and randomly selects some formal ordinary employees of Beijing T as the survey objects and obtains a total of 413 questionnaires. The demographic characteristics of the respondents were as follows:
Finally, 413 valid samples were recovered through investigation, and the basic information of the samples is shown in Table 14.
| Variable | Category | Frequency | Percentage | ||
| Gender | Male | 221 | 53.5 | ||
| Female | 192 | 46.5 | |||
| Age | Under 25 years old | 37 | 9 | ||
| 26-35 years old | 71 | 17.2 | |||
| 36-45years old | 149 | 36.1 | |||
| Over 45 years old | 156 | 37.8 | |||
|
College | 66 | 16 | ||
| Undergraduate | 156 | 37.8 | |||
| Master | 99 | 24 | |||
| Ph.D. | 92 | 22.3 | |||
|
Under 5 years | 60 | 14.5 | ||
| 6-10 years | 125 | 30.3 | |||
| 11-20 years | 131 | 31.7 | |||
| Over 20years | 97 | 23.5 |
In descriptive statistical analysis, the index level of each variable is generally measured through the mean and standard deviation. The higher the average value, the higher the average level of the sample for this indicator. The highest value represents the data range of the sample. The discrete trend is used to describe the degree of dispersion of the data in the data distribution. For example, the standard deviation indicates the size of the difference between different samples on the same indicator. For the scale observation in this questionnaire, the five-level Likert scale is mainly adopted, and the higher the score, the higher the degree of agreement. Looking at Table 15, it presents the statistical summary of various items in the questionnaire. The scores for each item fall within the range of 2.697 to 3.552. This range suggests a moderate level of agreement among respondents, as the scores are neither at the extremes of the scale. The standard deviations for these items range from 1.039 to 1.162. These values indicate a moderate degree of variability in responses. A lower standard deviation would imply more consensus, with responses clustering closely around the mean, while a higher standard deviation would signal greater disagreement or diversity in opinions among the respondents.
| Items | Minimum | Maximum | Average | S.D. |
|---|---|---|---|---|
| Charisma1 | 1 | 5 | 3.312 | 1.126 |
| Charisma2 | 1 | 5 | 3.552 | 1.088 |
| Charisma3 | 1 | 5 | 3.509 | 1.125 |
| Inspirational1 | 1 | 5 | 3.533 | 1.111 |
| Inspirational2 | 1 | 5 | 3.240 | 1.072 |
| Inspirational3 | 1 | 5 | 3.310 | 1.124 |
| Intellectual Stimulation1 | 1 | 5 | 3.252 | 1.145 |
| Intellectual Stimulation2 | 1 | 5 | 3.392 | 1.073 |
| Intellectual Stimulation3 | 1 | 5 | 3.521 | 1.053 |
| Individualized Consideration1 | 1 | 5 | 3.080 | 1.128 |
| Individualized Consideration2 | 1 | 5 | 3.283 | 1.162 |
| Individualized Consideration3 | 1 | 5 | 3.182 | 1.097 |
| Organizational Innovation Performance1 | 1 | 5 | 2.758 | 1.161 |
| Organizational Innovation Performance2 | 1 | 5 | 2.697 | 1.039 |
| Organizational Innovation Performance3 | 1 | 5 | 3.002 | 1.076 |
| Organizational Innovation Performance4 | 1 | 5 | 2.969 | 1.098 |
| Organizational Innovation Performance5 | 1 | 5 | 3.271 | 1.123 |
| Organizational Innovation Performance6 | 1 | 5 | 3.465 | 1.098 |
As can be seen from Table 16, the independent sample t-test revealed that the p-values for all the variables—charisma influence, vision motivation, talent stimulation, individual care, and organizational innovation performance—were greater than 0.05. This threshold of 0.05 is commonly used as a significance level in hypothesis testing. A p-value exceeding this level suggests that the observed differences between the genders are not statistically significant; in other words, they could likely be attributed to random variation rather than genuine gender-based disparities.
This finding implies that, within the context of this study, gender does not play a discernible role in influencing the levels of charisma, vision motivation, talent stimulation, individual care, or organizational innovation performance. Both male and female participants exhibit similar average scores and variability concerning these variables.
| Variable | Gender | Cases | Average | S.D. | t | p | ||
|---|---|---|---|---|---|---|---|---|
| Charisma | Male | 221 | 3.484 | 0.955 | 0.609 | 0.543 | ||
| Female | 192 | 3.427 | 0.944 | |||||
| Inspirational | Male | 221 | 3.341 | 0.921 | -0.467 | 0.641 | ||
| Female | 192 | 3.384 | 0.940 | |||||
|
Male | 221 | 3.416 | 0.852 | 0.663 | 0.508 | ||
| Female | 192 | 3.356 | 1.000 | |||||
|
Male | 221 | 3.225 | 0.915 | 0.998 | 0.319 | ||
| Female | 192 | 3.132 | 0.974 | |||||
|
Male | 221 | 3.029 | 0.894 | 0.058 | 0.954 | ||
| Female | 192 | 3.024 | 0.892 |
As can be seen from Table 17, the mean and standard deviation of different ages in charisma influence, vision motivation, talent stimulation, individual care, and organizational innovation performance. The influence of charm differs significantly in age (F=13.116, p<0.001). Further multiple comparisons show that the influence of charm over the age of 45 is significantly higher than that under the age of 45, and the influence of charm between the age of 26-45 is significantly higher than that under the age of 25.
There was no significant difference in vision motivation in age (F=0.904, p>0.05). There was no significant difference in intelligence stimulation with age (F=0.343, p>0.05). Individual care has a significant difference in age (F=12.827, p<0.001). Further multiple comparisons show that individual care over the age of 45 is significantly higher than that under the age of 45, and individual care between the ages of 36-45 is significantly higher than that under the age of 35. There is no significant difference in organizational innovation performance in age (F=0.406, p>0.05).
| Variable | Age | Cases | Average | S.D. | F | p | |||
|---|---|---|---|---|---|---|---|---|---|
| Charisma | Under 25 years old | 37 | 2.865 | 0.880 | 13.116 | 0.000 | |||
| 26-35 years old | 71 | 3.385 | 0.927 | ||||||
| 36-45years old | 149 | 3.307 | 0.978 | ||||||
| Over 45 years old | 156 | 3.776 | 0.837 | ||||||
| Inspirational | Under 25 years old | 37 | 3.171 | 0.866 | 0.904 | 0.439 | |||
| 26-35 years old | 71 | 3.427 | 0.930 | ||||||
| 36-45years old | 149 | 3.320 | 0.976 | ||||||
| Over 45 years old | 156 | 3.415 | 0.897 | ||||||
|
Under 25 years old | 37 | 3.270 | 0.864 | 0.343 | 0.794 | |||
| 26-35 years old | 71 | 3.366 | 0.987 | ||||||
| 36-45years old | 149 | 3.380 | 0.930 | ||||||
| Over 45 years old | 156 | 3.434 | 0.905 | ||||||
|
Under 25 years old | 37 | 2.667 | 0.667 | 12.827 | 0.000 | |||
| 26-35 years old | 71 | 2.793 | 0.942 | ||||||
| 36-45years old | 149 | 3.219 | 0.904 | ||||||
| Over 45 years old | 156 | 3.444 | 0.936 | ||||||
|
Under 25 years old | 37 | 2.905 | 0.958 | 0.406 | 0.749 | |||
| 26-35 years old | 71 | 2.977 | 0.923 | ||||||
| 36-45years old | 149 | 3.044 | 0.894 | ||||||
| Over 45 years old | 156 | 3.063 | 0.865 |
| Variable | Education Background | Cases | Average | S.D. | F | p | |||
|---|---|---|---|---|---|---|---|---|---|
| Charisma | College | 66 | 3.278 | 0.964 | 2.241 | 0.083 | |||
| Undergraduate | 156 | 3.383 | 0.943 | ||||||
| Master | 99 | 3.599 | 0.911 | ||||||
| Ph.D. | 92 | 3.562 | 0.970 | ||||||
| Inspirational | College | 66 | 3.278 | 0.974 | 0.635 | 0.593 | |||
| Undergraduate | 156 | 3.314 | 0.853 | ||||||
| Master | 99 | 3.431 | 0.927 | ||||||
| Ph.D. | 92 | 3.424 | 1.024 | ||||||
|
College | 66 | 2.919 | 0.849 | 16.534 | 0.000 | |||
| Undergraduate | 156 | 3.237 | 0.920 | ||||||
| Master | 99 | 3.529 | 0.861 | ||||||
| Ph.D. | 92 | 3.830 | 0.828 | ||||||
|
College | 66 | 3.172 | 0.938 | 0.561 | 0.641 | |||
| Undergraduate | 156 | 3.111 | 0.923 | ||||||
| Master | 99 | 3.236 | 0.887 | ||||||
| Ph.D. | 92 | 3.250 | 1.040 | ||||||
|
College | 66 | 2.740 | 0.809 | 18.541 | 0.000 | |||
| Undergraduate | 156 | 2.763 | 0.857 | ||||||
| Master | 99 | 3.204 | 0.880 | ||||||
| Ph.D. | 92 | 3.491 | 0.787 |
From Table 18, it can be seen that the mean and standard deviation of different educational backgrounds in charisma influence, vision motivation, talent stimulation, individual care, and organizational innovation performance. Charisma has no significant difference in educational background (F=2.241, p>0.05). There was no significant difference in educational background in vision motivation (F=2.241, p>0.05). There are significant differences in intellectual arousal in terms of educational background (F=16.534, p<0.001). Further multiple comparisons show that the intellectual arousal of doctoral students is significantly higher than that of master's students and below, and the intellectual arousal of master's students is significantly higher than that of undergraduate students and below, the intelligence stimulation of undergraduates is significantly higher than that of junior colleges. Individual care has no significant difference in education (F=0.561, p>0.05). There is a significant difference in organizational innovation performance in terms of academic qualifications (F=16.534, p<0.001). Further multiple comparisons show that the organizational innovation performance of doctoral students is significantly higher than that of master's students and below, and the organizational innovation performance of master's students is significantly higher than that of bachelor's degree and below.
| Variable | Work Experience | Cases | Average | S.D. | F | p | ||
|---|---|---|---|---|---|---|---|---|
| Charisma | Under 5 years | 60 | 3.122 | 0.864 | 8.777 | 0.000 | ||
| 6-10 years | 125 | 3.269 | 1.004 | |||||
| 11-20 years | 131 | 3.552 | 0.907 | |||||
| Over 20years | 97 | 3.780 | 0.869 | |||||
| Inspirational | Under 5 years | 60 | 3.406 | 0.864 | 0.138 | 0.938 | ||
| 6-10 years | 125 | 3.323 | 0.995 | |||||
| 11-20 years | 131 | 3.359 | 0.912 | |||||
| Over 20years | 97 | 3.385 | 0.915 | |||||
|
Under 5 years | 60 | 3.394 | 0.886 | 0.442 | 0.723 | ||
| 6-10 years | 125 | 3.312 | 0.998 | |||||
| 11-20 years | 131 | 3.417 | 0.894 | |||||
| Over 20years | 97 | 3.443 | 0.891 | |||||
|
Under 5 years | 60 | 2.706 | 0.796 | 15.084 | 0.000 | ||
| 6-10 years | 125 | 2.968 | 0.994 | |||||
| 11-20 years | 131 | 3.313 | 0.889 | |||||
| Over 20years | 97 | 3.574 | 0.836 | |||||
|
Under 5 years | 60 | 3.000 | 0.966 | 0.074 | 0.974 | ||
| 6-10 years | 125 | 3.016 | 0.974 | |||||
| 11-20 years | 131 | 3.024 | 0.823 | |||||
| Over 20years | 97 | 3.062 | 0.833 |
From Table 19, it can be seen that the mean and standard deviation of different working years in charisma influence, vision motivation, talent stimulation, individual care, and organizational innovation performance. The influence of charm differs significantly in terms of working years (F=8.777, p<0.001). Further multiple comparisons show that the influence of charm over 20 years is significantly higher than that under 10 years, and the influence of charm between 10 and 20 years is significantly higher than that of 10 years the following. Vision incentives have no significant difference in working years (F=0.138, p>0.05). There was no significant difference in intellectual stimulation in terms of working years (F=0.442, p>0.05). Individual care has a significant difference in working years (F=15.084, p<0.001), personal care over 20 years is significantly higher than that of less than 20 years, and personal care of 10-20 years is significantly higher than that of less than 10 years. There is no significant difference in organizational innovation performance in terms of working years (F=0.074, p>0.05).
The Pearson correlation coefficient is used to measure the linear relationship between two distance variables. The value of the correlation coefficient is between -1 and 1, and the larger the absolute value, the stronger the correlation between the two. The closer the correlation coefficient is to 1 or -1, the stronger the correlation is, and vice versa. In addition, judging the correlation relationship needs to consider the correlation coefficient and the significance level comprehensively. Only when the correlation coefficient is greater than 0 and the significance level p<0.05 can it be said that the variables are related. Therefore, This article uses the Pearson correlation coefficient to verify whether there is a correlation between variables.
It can be seen from Table 20 that there is a significant positive correlation between organizational innovation performance and charisma (r=0.348, p<0.01); there is a significant positive correlation between organizational innovation performance and vision incentives (r=0.323, p<0.01); There is a significant positive correlation with intellectual stimulation (r=0.391, p<0.01); there is a significant positive correlation between organizational innovation performance and individual care (r=0.310, p<0.01). Therefore, the hypothesis is tentatively supported.
| 1 | 2 | 3 | 4 | 5 | 6 | 7 | 8 | 9 | |
|---|---|---|---|---|---|---|---|---|---|
| 1.Gender | 1 | ||||||||
| 2.Age | 0.020 | 1 | |||||||
| 3.Education Background | -0.091 | 0.132** | 1 | ||||||
| 4.Work Experience | 0.033 | 0.736** | 0.043 | 1 | |||||
| 5.Charisma | -0.030 | 0.265** | 0.114* | 0.244** | 1 | ||||
| 6.Inspirational | 0.023 | 0.048 | 0.062 | 0.005 | 0.440** | 1 | |||
| 7.Intellectual Stimulation | -0.033 | 0.048 | 0.329** | 0.037 | 0.377** | 0.233** | 1 | ||
| 8.Individualized Consideration | -0.049 | 0.288** | 0.047 | 0.315** | 0.419** | 0.357** | 0.210** | 1 | |
| 9.Organizational Innovation Performance | -0.003 | 0.052 | 0.329** | 0.022 | 0.348** | 0.323** | 0.391** | 0.310** | 1 |
| Note: *p0.05, **p0.01 | |||||||||
| Variable | Model 1 | Model 2 | ||||
| t | p | t | p | |||
| Gender | 0.027 | 0.575 | 0.566 | 0.038 | 0.913 | 0.362 |
| Age | 0.006 | 0.090 | 0.928 | -0.045 | -0.714 | 0.476 |
| Education Background | 0.330 | 6.953 | 0.000 | 0.244 | 5.445 | 0.000 |
| Work Experience | 0.002 | 0.031 | 0.975 | -0.056 | -0.885 | 0.376 |
| Charisma | 0.136 | 2.601 | 0.010 | |||
| Inspirational | 0.139 | 2.887 | 0.004 | |||
| Intellectual Stimulation | 0.194 | 4.069 | 0.000 | |||
| Individualized Consideration | 0.183 | 3.744 | 0.000 | |||
| R2 | 0.109 | 0.302 | ||||
| AdjR2 | 0.100 | 0.288 | ||||
| R2 | 0.109 | 0.193*** | ||||
| F | 12.462*** | 21.815*** | ||||
| Note: ***p<0.001 | ||||||
In the examination of factors influencing organizational innovation performance, regression analysis serves as a powerful tool to disentangle the complex relationships between multiple variables. Table 21 presents the results of a hierarchical regression analysis, which is a statistical method that allows researchers to assess the incremental contribution of sets of predictor variables in explaining the variance of a dependent variable.
Model 1 focuses solely on the impact of control variables on organizational innovation performance. Control variables are extraneous factors that might influence the dependent variable and need to be accounted for to ensure the accuracy of the analysis. These variables could include demographic characteristics, organizational size, industry type, or other relevant factors that are not the primary focus of the study but could affect the outcome. The explanation rate of 10.0% indicates that these control variables collectively account for 10% of the variance in organizational innovation performance. This suggests that while control variables do play a role, a substantial portion of the variance remains unexplained, highlighting the need to consider additional factors. The significance of the linear relationship, as indicated by the F-value of 12.462 and a p-value less than 0.001, means that the relationship between the control variables and organizational innovation performance is unlikely due to chance. This statistical significance underscores the importance of considering these variables in the analysis, even though their explanatory power is relatively limited.
| Research hypothesis | Inspection results |
|---|---|
| H1: Respondents with different personal characteristics have significant differences in transformational leadership. | Partially accepted |
| H1a: Gender has significant differences in transformational leadership. | Not accepted |
| H1b: Age makes a significant difference for transformational leadership. | Partially accepted |
| H1c: education makes a significant difference to transformational leadership. | Partially accepted |
| H1d: Working years have significant differences for transformational leaders. | Partially accepted |
| H2: Respondents with different personal characteristics have significant differences in organizational innovation performance. | Partially accepted |
| H2a: Gender has a significant difference on organizational innovation performance. | Not accepted |
| H2b: Age has a significant difference on organizational innovation performance. | Not accepted |
| H2c: Education has a significant difference on organizational innovation performance. | Accepted |
| H2d: Working years have a significant difference on organizational innovation performance. | Not accepted |
| H3: Transformational leadership has a significant positive impact on organizational innovation performance. | Accepted |
| H3a: Charisma influence has a significant positive impact on organizational innovation performance. | Accepted |
| H3b: Vision incentive has a significant positive impact on organizational innovation performance. | Accepted |
| H3c: Talent stimulation has a significant positive impact on organizational innovation performance. | Accepted |
| H3d: Individual care has a significant positive impact on organizational innovation performance. | Accepted |
Model 2 builds upon Model 1 by incorporating transformational leadership as an additional predictor. Transformational leadership is a leadership style that emphasizes inspiring and motivating followers, fostering innovation, and driving organizational change. The substantial increase in the explanation rate to 28.8% demonstrates that transformational leadership significantly enhances the model's ability to account for the variance in organizational innovation performance. This suggests that transformational leadership is a crucial factor that interacts with the control variables to shape innovation outcomes within organizations.
The F-value of 21.815 and a p-value below 0.001 further confirm the statistical significance of the overall model. This means that the combination of control variables and transformational leadership provides a reliable and meaningful explanation of the variance in organizational innovation performance.
Looking at the individual predictors within Model 2, several insights emerge. Gender shows a negligible effect (=0.038, p>0.05), implying that, within the context of this study, an individual's gender does not significantly influence their contribution to or impact on organizational innovation performance. Similarly, age (=-0.045, p>0.05) does not exhibit a substantial or statistically significant relationship with innovation performance, suggesting that older or younger employees are equally capable of driving innovation when other factors are controlled for.
Education, however, stands out as a strong positive predictor (=0.244, p<0.001). This indicates that higher levels of education are associated with greater contributions to organizational innovation. This could be attributed to enhanced knowledge, skills, and cognitive abilities that individuals with higher education bring to the workplace, enabling them to engage more effectively in innovative activities.
Work experience (=-0.056, p>0.05) does not show a significant impact, which might seem counterintuitive. However, it could reflect that mere accumulation of years in a job does not necessarily translate to increased innovation, unless accompanied by relevant learning, adaptability, and exposure to new ideas and practices.
Among the dimensions of transformational leadership, charisma (=0.136, p<0.01), vision incentives (=0.139, p<0.01), talent stimulation (=0.194, p<0.001), and individual care (=0.183, p<0.001) all exhibit significant positive relationships with organizational innovation performance. Charisma enables leaders to inspire and motivate followers through their personal qualities and vision. Vision incentives involve articulating a compelling future direction that aligns employees' efforts towards innovative goals. Talent stimulation refers to the leader's ability to recognize and develop employees' capabilities, fostering an environment where innovative thinking can flourish. Individual care demonstrates that leaders' attention to employees' personal and professional well-being can enhance trust and psychological safety, which are essential for creative expression and risk-taking in innovation.
The support for the hypothesis signifies that the theoretical framework underpinning the study holds empirical validity within the context of this research. It suggests that transformational leadership, alongside certain control variables like education, plays a pivotal role in driving organizational innovation performance. This finding has practical implications for organizations seeking to enhance their innovation capabilities. By cultivating transformational leadership behaviors and investing in employees' education and development, organizations can create an environment conducive to innovation.
Judging from the verification results of the above-mentioned difference analysis and regression analysis, most of the research hypotheses have been confirmed, but some research hypotheses are still untenable. The specific relevant hypothesis verification results are shown in Table 22.
The paper proposes that leaders ought to embrace transformational leadership, exemplify desired behaviors, and establish a compelling organizational vision to motivate innovation. They should promote collaborative knowledge exchange and cultivate problem-solving skills among employees, while also fostering a culture that supports innovation and personal growth. Additionally, leaders should be flexible in their motivational tactics, updating their methods to align with the organization's ongoing development to avoid stagnation that could hinder employee innovation.
This study examines the effect of transformational leadership on organizational innovation performance. It confirms that the leadership's charisma, vision, motivation, talent stimulation, and personalized care positively influence innovation outcomes. Leaders can enhance innovation by showcasing their business acumen, fostering a culture of innovation, and clearly communicating organizational goals and individual development paths. This approach encourages employees to engage in independent innovation, thereby improving overall organizational innovation performance.
T company leaders should encourage employees to go beyond their personal interests and devote to their careers. As the company develops, the leadership style needs to change to avoid employee fatigue. Leaders should stimulate employees to innovate, improve the personnel management system and corporate culture, and provide welfare support through incentive mechanisms and special funds. At the organizational level, establish smooth communication channels between leaders and employees, and create a positive atmosphere of innovation. The company should establish a communication and interaction mechanism between internal departments, leaders at all levels and employees, shorten the internal communication process of the organization, and stimulate the vitality of the talent team. At the same time, consider the differences of employees' personal characteristics to promote the construction of modern organizational system. With the expansion of the company and the deepening of collectivization, the management boundary is gradually blurred, all departments and companies should continue to promote management reform.
This study has several limitations. Firstly, it is a single - case study of Beijing T Company, which may limit the universality of the findings. Other companies' unique structures and environments might influence the relationship between transformational leadership and innovation performance. Secondly, the cross - sectional design only provides a snapshot at one time point, making it hard to capture the dynamic and causal mechanisms of the complex innovation process influenced by multiple factors. Thirdly, sample selection was restricted by practical factors like the pandemic, potentially causing bias and reducing the representativeness of the sample. The sample size may also affect result accuracy. Fourthly, data from employee questionnaires may be subjective, influenced by personal emotions and biases. Lastly, the analysis methods have limitations. Statistical methods like regression analysis assume linear relationships, which may not hold true. The constructed models might not fully reflect reality due to simplification. Addressing these limitations in future research could enhance the validity and reliability of the findings.

Portico
All published articles are preserved here permanently:
https://www.portico.org/publishers/icck/