

Smart Environmental Monitoring and Management System for Water Quality Using Web-Based Data Analysis




Article Information
Abstract
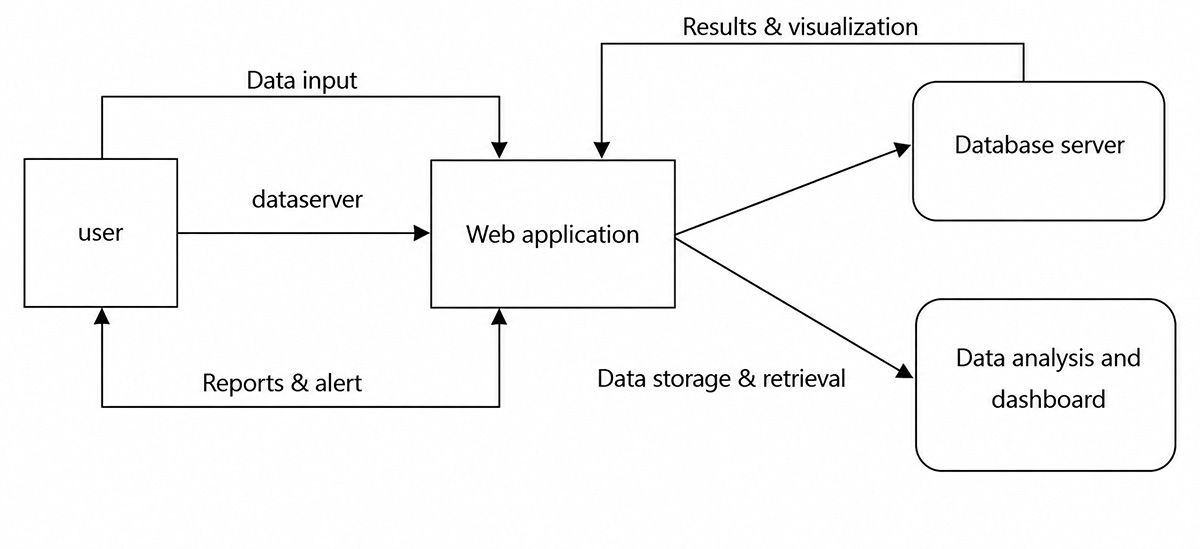
In India, a large population depends on local water bodies such as ponds for daily use, yet the quality of these small, community-level sources is rarely monitored or made publicly accessible, even though contamination from waste disposal, human and animal faecal matter, plastic pollution, and poor sanitation makes timely monitoring essential for reducing public-health and environmental risks. This paper presents a smart environmental monitoring and management system that combines laboratory-based water quality testing with a web-based data-analysis platform. Twenty water samples were collected from ponds and public sources in Berhampur, Odisha, and analysed for pH, dissolved oxygen, chlorinity, salinity, temperature, hydrogen sulphide (H\textsubscript{2}S), and microbial contamination. Each sample was compared against WHO and BIS (IS~10500) drinking-water limits and classified, through a rule-based decision procedure, into Safe, Moderate, or Not Safe categories. All records are stored in a structured database and presented through an interactive dashboard that supports historical comparison and public data contribution. Of the 20 samples, 9 (45%) were classified as Safe, 4 (20%) as Moderate, and 7 (35%) as Not Safe. Samples in the Not Safe category showed the highest average chlorinity, salinity, and H\textsubscript{2}S values, confirming that chloride load and bacterial activity were the dominant contamination indicators in the study area. The results show that coupling low-cost laboratory testing with an accessible web platform provides a practical and scalable way to monitor local water bodies, raise community awareness, and build a shared dataset for researchers, students, and local communities, while remaining open to future integration of IoT sensors and machine learning.
Graphical Abstract
Keywords
Data Availability Statement
Funding
Conflicts of Interest
AI Use Statement
Ethical Approval and Consent to Participate
References
- Garrido-Momparler, V., & Peris, M. (2022). Smart sensors in environmental/water quality monitoring using IoT and cloud services. Trends in Environmental Analytical Chemistry, 35, e00173.
[CrossRef] [Google Scholar] - Hridoy, M. A. A. M., Shawkat, A. I., Bordin, C., Acharjee, M. R., Masood, A., Baki, A. O., & Al Mamun, M. A. (2025). Advanced machine learning models for accurate water quality classification and WQI prediction: Implications for aquatic disease risk management. Science of the Total Environment, 1008, 180965.
[CrossRef] [Google Scholar] - Batty, M., Axhausen, K. W., Giannotti, F., Pozdnoukhov, A., Bazzani, A., Wachowicz, M., ... & Portugali, Y. (2012). Smart cities of the future. The European physical journal special topics, 214(1), 481-518.
[CrossRef] [Google Scholar] - Gubbi, J., Buyya, R., Marusic, S., & Palaniswami, M. (2013). Internet of Things (IoT): A vision, architectural elements, and future directions. Future generation computer systems, 29(7), 1645-1660.
[CrossRef] [Google Scholar] - Shixian, Z., & Rui, X. (2018). Research and development of water quality online monitoring system based on Internet of things technology. Desalination and Water Treatment, 122, 25-29.
[CrossRef] [Google Scholar] - Khare, R., & Kushwaha, S. (2025). Predictive modeling of water quality index using machine learning technique. International Journal of Environmental Sciences, 5(11), 1544--1553.
[CrossRef] [Google Scholar] - World Health Organization. (2022). Guidelines for Drinking-water Quality: Fourth Edition Incorporating the First and Second Addenda. World Health Organization, Geneva. Retrieved from https://www.who.int/publications/i/item/9789240045064
[Google Scholar] - Bureau of Indian Standards. (2012). IS 10500:2012 --- Indian Standard: Drinking Water --- Specification (Second Revision). Bureau of Indian Standards, New Delhi. Retrieved from https://archive.org/details/gov.in.is.10500.2012
[Google Scholar]
Cite This Article
TY  - JOUR
AU  - Samantara, Ipsita Kumari
AU  - Pattanaik, Chinmayee
PY  - 2026
DA  - 2026/09/09
TI  - Smart Environmental Monitoring and Management System for Water Quality Using Web-Based Data Analysis
JO  - Next-Generation Computing Systems and Technologies
T2  - Next-Generation Computing Systems and Technologies
JF  - Next-Generation Computing Systems and Technologies
VL  - 2
IS  - 3
SP  - 109
EP  - 122
DO  - 10.62762/NGCST.2026.715140
UR  - https://www.icck.org/article/abs/NGCST.2026.715140
KW  - water quality monitoring
KW  - smart environment system
KW  - web-based data analysis
KW  - water pollution
KW  - environment monitoring
KW  - waste disposal
KW  - public health
KW  - data management system
KW  - data visualization
AB  - In India, a large population depends on local water bodies such as ponds for daily use, yet the quality of these small, community-level sources is rarely monitored or made publicly accessible, even though contamination from waste disposal, human and animal faecal matter, plastic pollution, and poor sanitation makes timely monitoring essential for reducing public-health and environmental risks. This paper presents a smart environmental monitoring and management system that combines laboratory-based water quality testing with a web-based data-analysis platform. Twenty water samples were collected from ponds and public sources in Berhampur, Odisha, and analysed for pH, dissolved oxygen, chlorinity, salinity, temperature, hydrogen sulphide (H\textsubscript{2}S), and microbial contamination. Each sample was compared against WHO and BIS (IS~10500) drinking-water limits and classified, through a rule-based decision procedure, into Safe, Moderate, or Not Safe categories. All records are stored in a structured database and presented through an interactive dashboard that supports historical comparison and public data contribution. Of the 20 samples, 9 (45%) were classified as Safe, 4 (20%) as Moderate, and 7 (35%) as Not Safe. Samples in the Not Safe category showed the highest average chlorinity, salinity, and H\textsubscript{2}S values, confirming that chloride load and bacterial activity were the dominant contamination indicators in the study area. The results show that coupling low-cost laboratory testing with an accessible web platform provides a practical and scalable way to monitor local water bodies, raise community awareness, and build a shared dataset for researchers, students, and local communities, while remaining open to future integration of IoT sensors and machine learning.
SN  - 3070-3328
PB  - Institute of Central Computation and Knowledge
LA  - English
ER  -
@article{Samantara2026Smart,
  author = {Ipsita Kumari Samantara and Chinmayee Pattanaik},
  title = {Smart Environmental Monitoring and Management System for Water Quality Using Web-Based Data Analysis},
  journal = {Next-Generation Computing Systems and Technologies},
  year = {2026},
  volume = {2},
  number = {3},
  pages = {109-122},
  doi = {10.62762/NGCST.2026.715140},
  url = {https://www.icck.org/article/abs/NGCST.2026.715140},
  abstract = {In India, a large population depends on local water bodies such as ponds for daily use, yet the quality of these small, community-level sources is rarely monitored or made publicly accessible, even though contamination from waste disposal, human and animal faecal matter, plastic pollution, and poor sanitation makes timely monitoring essential for reducing public-health and environmental risks. This paper presents a smart environmental monitoring and management system that combines laboratory-based water quality testing with a web-based data-analysis platform. Twenty water samples were collected from ponds and public sources in Berhampur, Odisha, and analysed for pH, dissolved oxygen, chlorinity, salinity, temperature, hydrogen sulphide (H\textsubscript{2}S), and microbial contamination. Each sample was compared against WHO and BIS (IS~10500) drinking-water limits and classified, through a rule-based decision procedure, into Safe, Moderate, or Not Safe categories. All records are stored in a structured database and presented through an interactive dashboard that supports historical comparison and public data contribution. Of the 20 samples, 9 (45\%) were classified as Safe, 4 (20\%) as Moderate, and 7 (35\%) as Not Safe. Samples in the Not Safe category showed the highest average chlorinity, salinity, and H\textsubscript{2}S values, confirming that chloride load and bacterial activity were the dominant contamination indicators in the study area. The results show that coupling low-cost laboratory testing with an accessible web platform provides a practical and scalable way to monitor local water bodies, raise community awareness, and build a shared dataset for researchers, students, and local communities, while remaining open to future integration of IoT sensors and machine learning.},
  keywords = {water quality monitoring, smart environment system, web-based data analysis, water pollution, environment monitoring, waste disposal, public health, data management system, data visualization},
  issn = {3070-3328},
  publisher = {Institute of Central Computation and Knowledge}
}
Article Metrics
Publisher's Note
ICCK stays neutral with regard to jurisdictional claims in published maps and institutional affiliations.
Rights and Permissions
 Copyright © 2026 by the Author(s). Published by Institute of Central Computation and Knowledge. This article is an open access article distributed under the terms and conditions of the Creative Commons Attribution (CC BY) license (https://creativecommons.org/licenses/by/4.0/), which permits use, sharing, adaptation, distribution and reproduction in any medium or format, as long as you give appropriate credit to the original author(s) and the source, provide a link to the Creative Commons licence, and indicate if changes were made.


Portico
