
Abstract
Graphical Abstract

Click image to view fullscreen
Keywords
1. Introduction
In the realm of industrial vision recognition systems, the pivotal role of anomaly detection is paramount for guaranteeing the impeccable quality of products and maintaining the stability of manufacturing processes [1]. Traditional manual inspection methods struggle to meet the demands of efficient quality control in modern intelligent manufacturing environments due to their high cost and limited throughput. The evolution of computer vision and deep learning has propelled deep learning-based anomaly detection methods to the forefront, with applications spanning medical image diagnosis [2], industrial quality inspection [3, 4], and video surveillance [5].
In surface defect detection in industrial scenarios, the costly and time-consuming acquisition of anomalous samples limits the use of supervised anomaly detection [6, 7]. In practice, normal sample data dominates the dataset while abnormal sample data is relatively scarce or missing, so most anomaly detection methods are in unsupervised or semi-supervised form [8, 9]. The significant imbalance between normal and abnormal data renders supervised methods inapplicable for addressing anomaly detection challenges. Unsupervised anomaly detection methods are generally classified into self-encoder based [12, 13, 14], generative adversarial network based [15, 16, 17], and teacher-student (T-S) model based [18, 19] approaches. Among these, knowledge distillation-based methods have shown promise in unsupervised anomaly detection, attributed to their superior knowledge transfer and learning guidance capabilities. However, existing knowledge distillation methods primarily train on normal data and detect anomalies by identifying representational discrepancies between teacher and student models, which can result in reduced sensitivity to anomalous samples.
To address the limitations of current knowledge distillation methods, such as low anomaly sensitivity and imprecise localization, this paper introduces an unsupervised industrial anomaly detection method that integrates feature mask generation and reverse distillation techniques. This approach diverges from conventional T-S models by processing the original image solely through the teacher model to capture feature representations. Subsequently, the student model extracts the latent representation and reconstructs the image features at the original scale. Specifically, the initial step involves processing images via a pre-trained encoder, employed as a teacher model, to extract and derive pertinent features. These features are then channeled through an attention-based bottleneck module, which integrates local information via a multiscale feature fusion module to extract a more compact coding. This encoding is subsequently passed to the student model, in conjunction with a feature mask module, to restore the original feature representation. To refine the presentation of the model's loss function, it is devised utilizing the cosine proximity measure between the encoder's output features at each layer in the teacher model and the corresponding decoder's output features in the student model.
The main contributions delineated in this paper are as follows:
We introduce a masked reverse knowledge distillation technique aimed at augmenting the structural diversity within the T-S model framework, thereby bolstering its capabilities for anomaly detection and precise localization. This approach effectively addresses the pervasive issue of overgeneralization encountered in image-based anomaly detection systems, ensuring enhanced performance and robustness.
An attention mechanism is introduced to leverage the high-quality features derived from normal data training, assisting the student model in reconstructing multi-scale normal modal information.
The development of a feature mask generation module (FMM) refines the pixel representation by emphasizing feature pixels that encapsulate information about neighboring pixels, thereby enhancing the performance of the feature-based distillation approach.
The organization of this paper is structured in the following manner: In Section 2, we conduct an exhaustive examination of the pertinent literature, offering a comprehensive review of related work. Section 3 delves into the intricacies of the novel methodology proposed, providing a thorough elaboration. Subsequently, Section 4 showcases the experimental outcomes achieved on the widely accessible MVTec AD dataset, accompanied by a series of ablation studies aimed at substantiating the effectiveness of our proposed approach. Lastly, Section 5 brings the paper to a conclusion, reflecting on the key findings and contemplating potential avenues for future research endeavors.
2. Related Work
2.1 Reconstruction-Based Methods
At present, the primary detection approaches rooted in image reconstruction encompass a diverse set of methodologies, such as the Auto-Encoder (AE) framework, the Variational Auto-Encoder (VAE) [10] and the Generative Adversarial Network (GAN) paradigm [11]. Self-encoder based on methods use reconstruction error to determine anomalous samples. Kwon et al. [12] employ cosine similarity to measure the angular deviation of gradient vectors among normal samples, establishing consistency constraints for gradient vector directions to detect anomalies. Chu et al. [13] analyze the loss function's change curve to identify anomalous images within unlabeled datasets. Kim et al. [14] reduce the self-encoder's false positive rate by comparing the complexity of shapes, sizes, and colors in the learned samples.
These methods mainly rely on reconstruction error to identify abnormal samples. However, when the distribution of training samples is diversified, the reconstruction accuracy may be affected due to the lack of feature-level discriminant information, resulting in an increase of false detections and missed detections. Especially for complex anomaly patterns, relying solely on reconstruction errors may not adequately capture their properties.
GAN-based methods capitalize on the capability of GANs to generate realistic images, offering clearer reconstructions than self-encoders for anomaly detection. Schlegl et al. [15] introduce AnoGAN, which utilizes backward iterative propagation to pinpoint potential anomaly indicators. Akcay et al. [16] propose GANomaly, integrating an encoder to refine the traditional reconstruction error through multi-angle constraints, resulting in closer alignment of reconstructed images to originals. Schlegl et al. [17] further propose f-AnoGAN, replacing the AE decoder with a trained GAN generator for more direct image reconstruction leveraging GAN's generation prowess.
While GAN-based methods are able to generate more realistic images and thus provide a sharper reconstruction than autoencoders, they are similarly limited by a single evaluation criterion for reconstruction error. These methods do not make full use of the rich information contained in large-scale datasets, and only judging anomalies by reconstruction error may ignore the deep relationship and high-order features between data.
2.2 Knowledge Distillation
The methodology of knowledge distillation revolves around a pre-established teacher network and a student network that undergoes training. The foundation of knowledge distillation lies in the interaction between an established network of teacher and student network being trained. The teacher network serves a pivotal role as a feature extractor, while the student network is tasked with reconstructing exclusively the normal data, leveraging the insights garnered from the teacher. When anomalies are input, the student network, not trained on anomalous samples, exhibits a significant discrepancy in feature extraction compared to the teacher, leading to weaker anomaly reconstruction and enabling anomaly detection based on feature map differences.
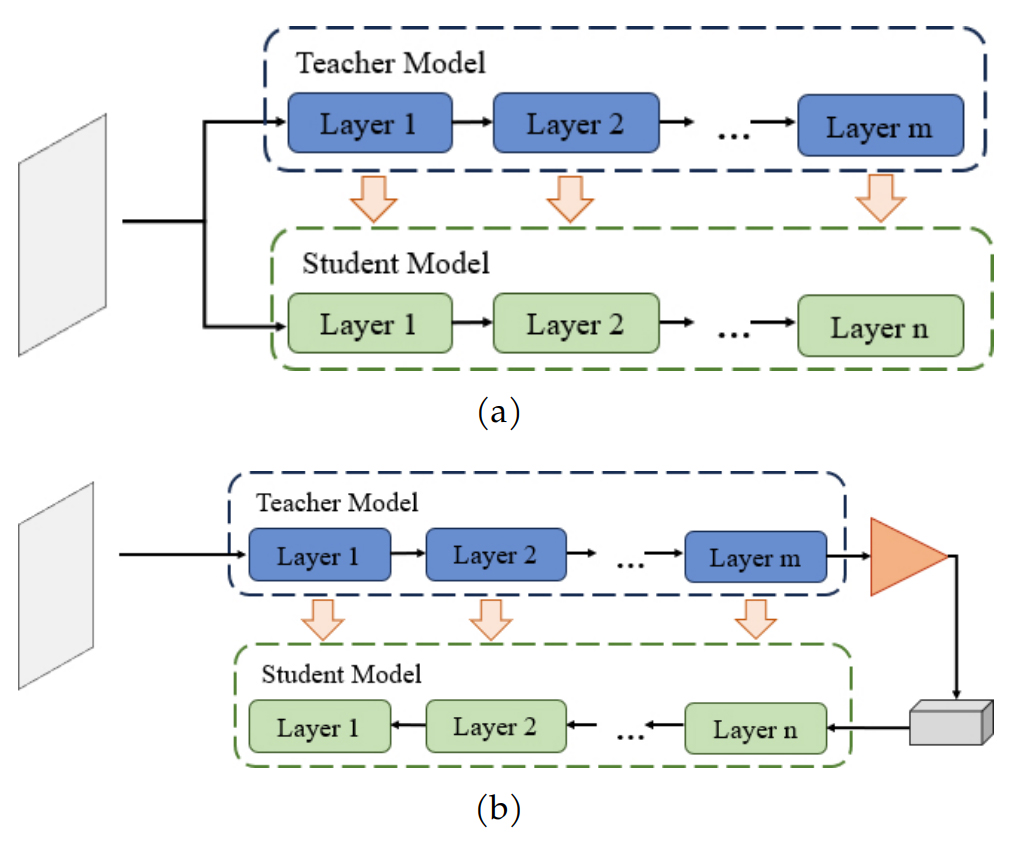
Bergmann et al. [7] have implemented knowledge distillation in the realm of unsupervised anomaly detection, where they employ a pre-trained teacher model to guide the training of a student model on a dataset exclusively comprising normal data. This approach aims to achieve maximal consistency between the embedding outputs generated by both models, thereby enhancing the effectiveness of anomaly detection. Salehi et al. [18] propose the MKD method to leverage the generalization ability of the middle layer semantic features. However, in knowledge distillation, the student model often mirrors the teacher model in terms of their architectural configuration or exhibits similarities, and the data flow is consistent between the two, which potentially lead to similar representations of anomalous data in both models. To address this issue, Deng et al. [19] propose the RD architecture, featuring a heterogeneous teacher encoder and student decoder structure. The configurations for both the standard knowledge distillation and the reverse distillation approaches are shown in Figure 1.
In the field of knowledge distillation, although the effect of anomaly detection can be improved through the interaction of teacher network and student network, there are still some shortcomings in the existing methods. Firstly, the student network often tends to imitate the architecture and representation of the teacher network, resulting in that the two may have similar representations on abnormal data, reducing the sensitivity to anomalies. Secondly, in the traditional knowledge distillation process, the data flow is single, which may limit the ability to extract effective features from abnormal data. In addition, when dealing with complex or hidden anomalies, existing knowledge distillation methods may not fully capture the unique characteristics of these anomalies, resulting in poor detection results.
To overcome these shortcomings, this paper proposes a new approach to integrate SimAM and SCConv modules into the knowledge distillation framework. The SimAM module is able to enhance the sensitivity of the model to abnormal data, while the SCConv module helps to capture richer contextual information. At the same time, the FMM was introduced to further improve the network's ability to understand the image context. These improvements make the model more accurate to distinguish between normal samples and abnormal samples, thereby improving the efficiency of anomaly detection.
In summary, the improvements in this paper not only solve the limitations of existing methods in anomaly detection, but also improve the detection performance and robustness of the model by introducing new modules and mechanisms.
3. Methodology
3.1 Overall Architecture
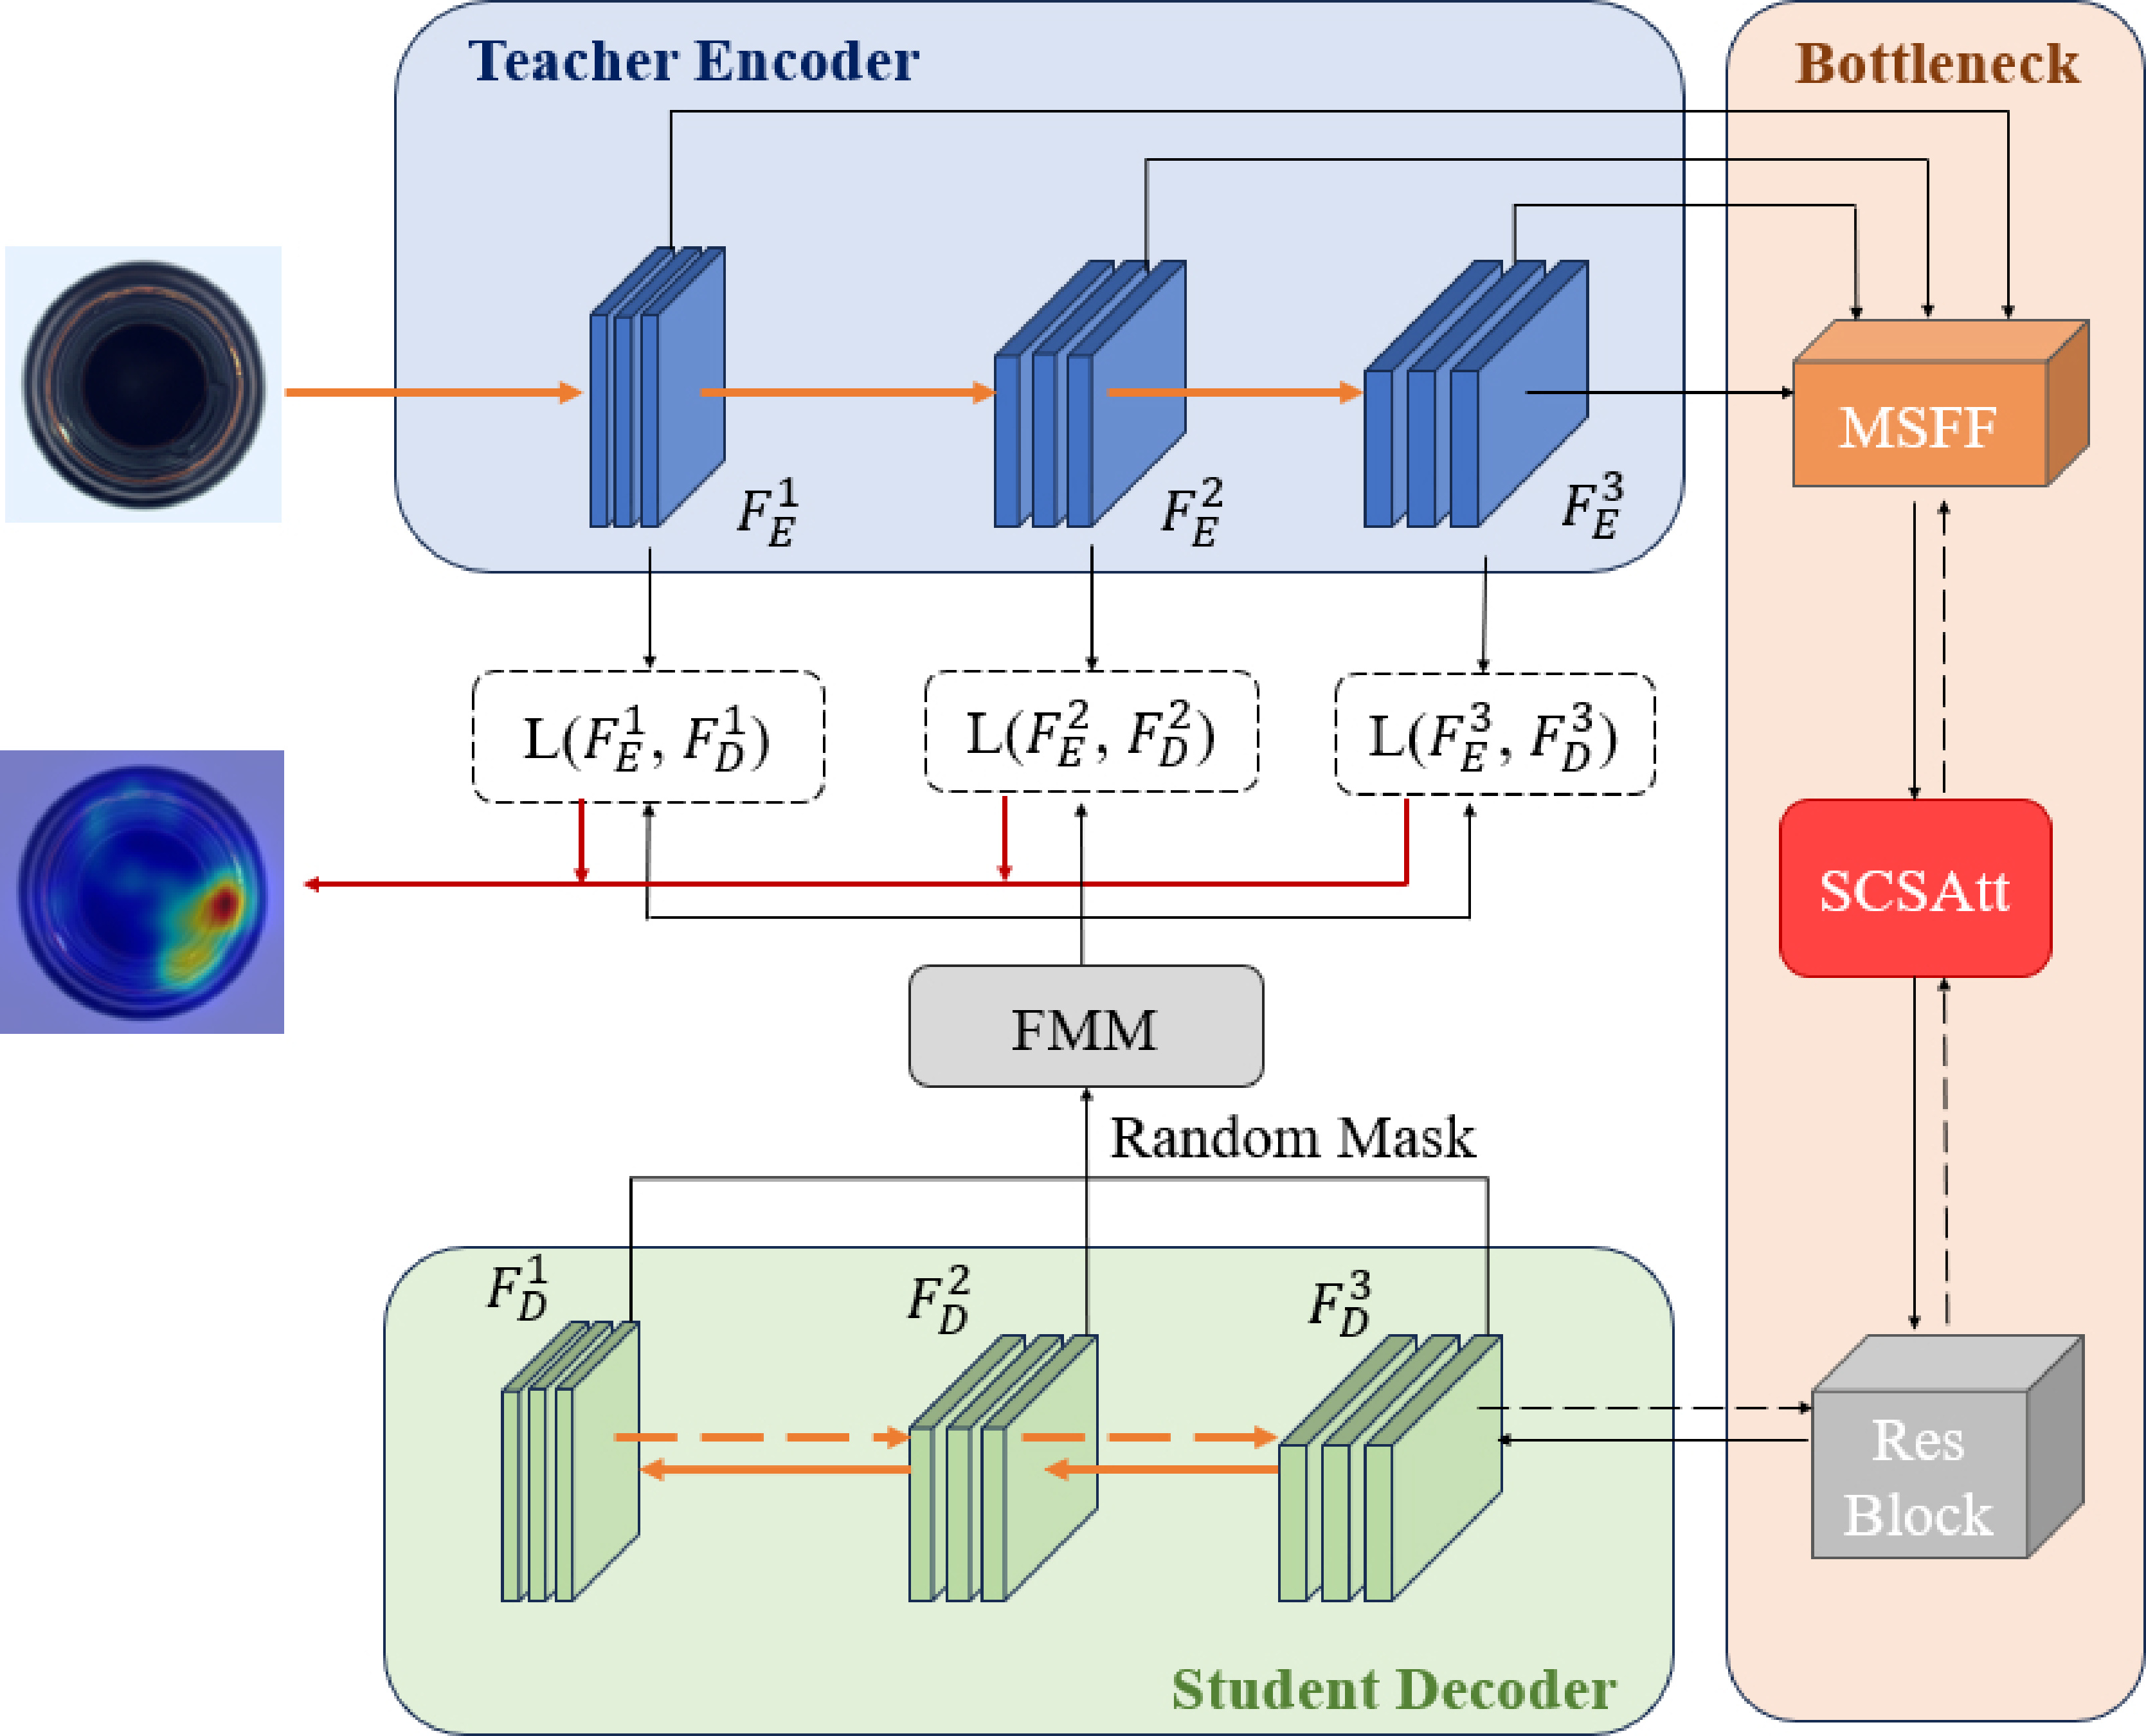
The presented approach's comprehensive framework, depicted in Figure 2, encapsulates the foundational structure of the inverse knowledge distillation paradigm, augmented by a strategic bottleneck module, and integrated with the Feature Modulation Mechanism (FMM). In this model, the central pillar for anomaly detection revolves around the utilization of reversed knowledge distillation, which harnesses an encoder-decoder paradigm as its fundamental structure. Utilizing the multi-scale feature fusion module (MSFF), the input feature maps are sequentially processed layer by layer, thereby outputting semantically richer feature maps through hierarchical fusion. The architecture incorporates a bottleneck unit, intricately woven with Spatial and Channel Reconstruction Convolutional blocks (SCConv) alongside a Simplified Attention Mechanism (SimAM), collectively referred to as the SCSAtt module, enables the model to capture cross-channel information and positional encoding information simultaneously. In the FMM, the model augments its anomaly detection capabilities by strategically obscuring pixel attributes within in a randomized fashion and subsequently employs a simple generative module to restore synthesized feature-level anomalies. These designs improve the model's accuracy and efficiency from multiple perspectives. In the following sections, the distinct roles and functionalities of each individual module will be elaborated upon in a comprehensive manner.
3.2 Reverse Distillation Model
In conventional knowledge distillation frameworks, the student network often mirrors the structure of the teacher model, either closely resembling or being identical to it, and processes raw imagery or data as its primary input. However, when anomalies occur in the model's operation, maintaining congruity in the T-S network architecture and data propagation pathways can potentially introduce data confusion during the knowledge transfer process, leading to the disappearance of activation differences and thus undermining the effectiveness of anomaly detection mechanisms. Although this issue can be mitigated by simplifying the network structure, it concurrently diminishes the model's precision in both identifying and pinpointing the targeted entities.
In an effort to confront the aforementioned obstacles, our study presents a novel reverse knowledge distillation framework, which leverages an encoder-decoder architecture to facilitate the transfer of knowledge from the teacher's deeper hierarchical levels towards the earlier layers of the student model. In this model, the teacher model processes the image to learn feature representations, while the student model is tasked with recovering these representations. To enhance single-category refinement, a bottleneck module is designed to bridge the teacher and student models.
In the process of training, taking into account the proficiency of ResNet [20] and WideResNet [21] architectures in distilling intricate features from image data, we opted for the WideResNet50 model, which had undergone pre-training on ImageNet [22], as our teacher network encoder to facilitate the extraction of comprehensive and nuanced semantic information, and froze the teacher model parameters to ensure its effectiveness in extracting anomaly features during the inference phase. The input image undergoes a process of feature extraction by the teacher network, resulting in a set of features denoted as , where the superscript represents the -th block within the teacher network architecture. After obtaining the output features, they are sent into the bottleneck module to generate a compact feature representation . In order to align with the characteristic representations of the instructor encoder, the student network incorporates a decoder architecture that mirrors the structure of the teacher network, ensuring a symmetrical configuration. To fulfill the objective of replicating the feature representation , the student network meticulously extracts the insights and characteristics encapsulated within the teacher network's output, and achieves learning of positive samples through comparison with the input data.
During the testing stage, the teacher model accurately extracts distinguishing characteristics from both standard and anomalous imagery. Nonetheless, the student model's capability in reconstructing the unique features of anomaly images remains incomplete, resulting in a notable discrepancy in the outputted features between the two models, thereby achieving the identification and detection of anomaly images.
3.3 Bottleneck Module
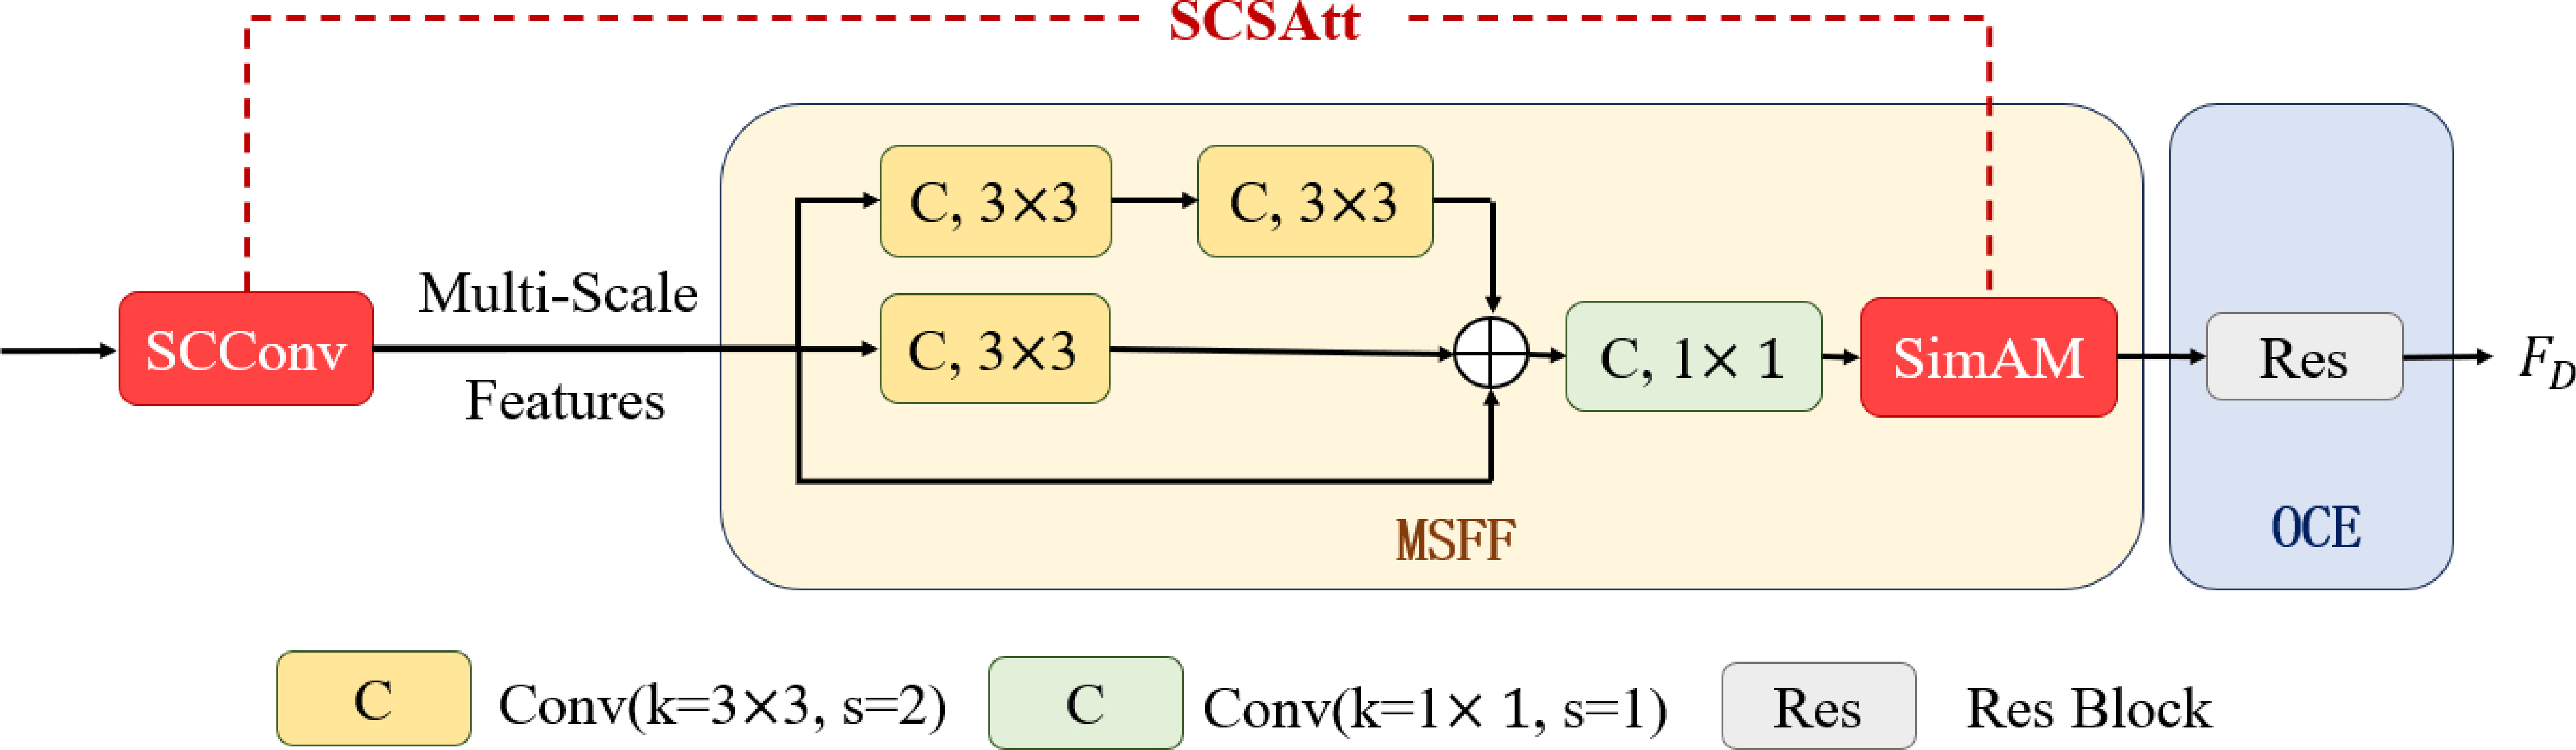
Figure 3 illustrates the structural design of the bottleneck module. In reverse knowledge distillation, the primary objective of the student network is to recover the feature representation that is embodied within the teacher network. However, directly connecting the terminal coding block of the teacher network for activation outputs may lead to redundant and anomalous information in the high-dimensional features affecting the efficacy of the student network's reconstruction process. Hence, the bottleneck module crafted within this study primarily encompasses three distinct components: the MSFF module for fusing different scale feature information, the SCSAtt for aggregating local data, and the OCE [19] for suppressing anomalous information. Subsequently, we will provide an introduction and analysis of each sub-module constituting the bottleneck module.
Within the MSFF module, three sets of input features, namely , and , are considered. To enable their integration, is down-sampled twice, while is down-sampled once, aligning their dimensions with that of . Each reduction in sample size is accomplished by utilizing a 3x3 convolutional layer with a stride of 2, which is then proceeded by Batch Normalization (BN), and lastly, a Rectified Linear Unit (ReLU) activation function is implemented to incorporate non-linear behavior. The post-down-sampling features, and , are then concatenated with the original features along the channel axis. Subsequent to this concatenation process, a 1x1 convolutional layer is implemented, featuring a stride of unity. This layer is accompanied by the utilization of a Rectified Linear Unit (ReLU) as the activation function and Batch Normalization, to yield a feature set that is both rich in information and compact in representation. The concise embedding mechanism effectively mitigates the dissemination of aberrant perturbations to the student model, thereby enhancing the distinctiveness of anomaly representations within the T-S framework.
3.4 SCSAtt Module
In the bottleneck module, the MSFF approach fuses multi-scale features extracted from the teacher network at the channel dimension, generating a fusion feature that matches the size of the last feature. However, there is a potential problem in this integration process: due to the texture information contained in the low-level features being compressed in the convolution operation, some feature information may become blurred. This makes it harder for subsequent layers to accurately recreate those elements, posing quite the conundrum for the neural net tasked with rebuilding them. When the results of this reconstruction are significantly different from the normal features of the teacher network, the model may misclassify.
To enhance the quality of the student network's initial features and boost its ability to detect unusual features, we designed SCSAtt module in the bottleneck module. This module comprises the Spatial and Channel reconstruction Convolution [23] (SCConv) and the Simple Parameter-Free Attention Module [24] (SimAM). As depicted in Figure 3, using SCConv instead of standard convolution to aggregate local information can reduce redundant features and enhance feature representation, while reducing complexity and computational cost. SimAM is placed after the convolution module used for modeling channel interactions, to readjust the output multi-scale fusion features. This mechanism not only helps to ensure a good feature representation of the student network at the initial stage, but also identifies and suppresses anomalous features, thus blocking the propagation of anomalous information.
3.5 Lightweight Convolutional Module Scconv
In the realm of computational efficiency, the SCConv module emerges as a compact convolutional component, leveraging feature redundancy compression as detailed in [24]. This module is composed of two integral units: the Spatial Reconstruction Unit (SRU) and the Channel Reconstruction Unit (CRU). The configuration of SCConv is visually depicted in Figure 4.
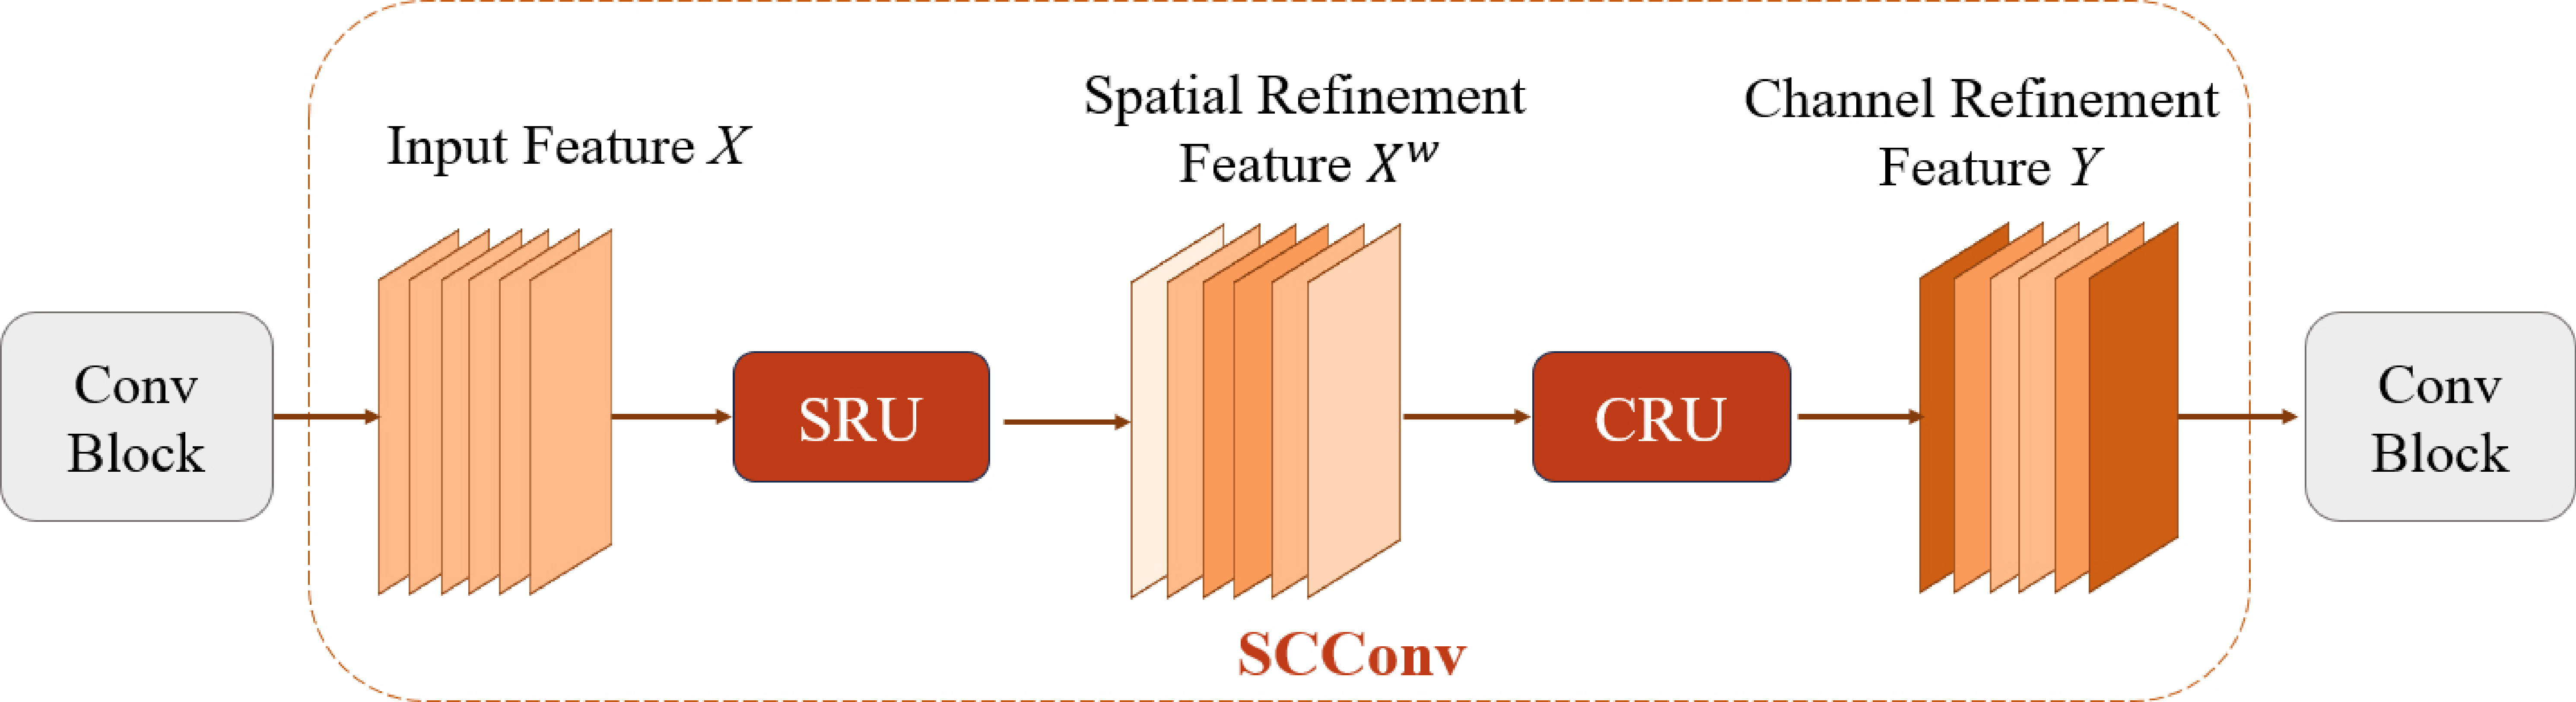
The SRU module incorporates a distinctive feature separation-reconstruction process. The primary goal of feature separation is to distinguish between less valuable and repetitive feature maps from those that are more valuable and crucial. In essence, the input feature maps are initially normalized as a group in both the vertical and horizontal dimensions.
where refers to the batch size, denotes the number of channels, and and represent the spatial dimensions of the feature map, namely the height and width, respectively. Within the framework of normalization techniques, and are the learnable parameters of an affine transformation that plays a crucial role in adjusting the feature maps. To ensure numerical stability, a minuscule positive constant is incorporated.
The mean () and standard deviation () of the input feature maps are calculated to standardize the distribution. Building upon this, the group normalization layer employs a trainable parameter , which is a vector in , to measure the variance of spatial pixels across each channel within the batch. This variance computation is pivotal for deriving the significance weights attributed to the distinct feature maps, thereby enhancing the model's ability to focus on the most informative features.
The gating process is implemented by thresholding the weights for reconstructing the input features. The correlation weights, denoted by , undergo a transformation through a sigmoid function, which effectively scales them to the interval (0, 1). Subsequently, a thresholding operation is applied to these normalized weights. Specifically, weights that exceed the threshold of 0.5 are assigned a value of 1, thereby identifying and highlighting the significant information weights, represented as . Conversely, weights falling below this threshold are set to 0, which helps in isolating the redundant information weights, denoted by .
The two weights are multiplied element-by-element with the input feature to obtain the important feature and the redundant feature and the features are reconstructed and merged by adding and to obtain the spatial refinement feature :
where denotes element-by-element multiplication, denotes element-by-element summation, and denotes channel splicing. After the input features are processed by SRU, the input features are meticulously evaluated to discern the informative from the less informative elements.
For the redundancy in the channel dimension, CRU is used for processing, which operates through a systematic three-step process: splitting, transforming, and fusing. Initially, the split is bifurcated into two segments—the upper half and the lower half . In the transformation phase, a grouped convolution (GWC) is applied to , complemented by a point-by-point convolution (PWC). These operations are strategically chosen over the conventional convolution to enhance feature representation. The results of these convolutions are then aggregated to form the feature map . After performing the PWC convolution on the outputs are again spliced with along the channels to obtain the feature map . The final stage, fusion, involves pooling the outputs to attenuate channel redundancy. During this phase, a channel descriptor is derived, enriched with global spatial information, through the pooling operation:
The channel descriptors are then stacked together using channel soft attention in order to generate significant feature vectors :
Finally, and combine to yield the channel refinement feature :
3.6 Parameter-free Attention Module Simam
SimAM is a complete three-dimensional, weighted, parameter-free attention mechanism [23], which can provide appropriate weights for neurons with spatial information in the neural network, while suppressing extraneous information from the surrounding neurons, effectively improving the feature extraction ability. Figure 5 illustrates the architecture of SimAM.

This module focuses precisely on key neurons and establishes the energy function, employing binary labeling and incorporating regular terms to ensure the target neuron achieves the lowest possible energy function.
where
and represent the mean and variance, respectively, of all neurons in the input feature channel, excluding the target neuron . Here, denotes the activations of other neurons within the same channel. The parameter serves as a regularization coefficient, which helps to control the influence of the energy function on the overall model.
Theoretically, for each channel, there exists an energy function that is a function of , where and are the spatial dimensions of the feature map. The formula implies that a lower energy value for a neuron indicates a higher degree of differentiation from its neighboring neurons, i.e., the more linearly distinguishable it is and the more important it is. Feature refinement is performed using the scaling operator:
where is the input feature, groups all across channels and spatial dimensions, and this collection of energy values is then subjected to a sigmoid function. The inclusion of the SCSAtt module empowers the model to allocate attention to the most informative parts of the input, thus potentially enhancing the overall performance of the model in terms of feature representation and reconstruction accuracy.
3.7 Feature Mask Generation Module (FMM)
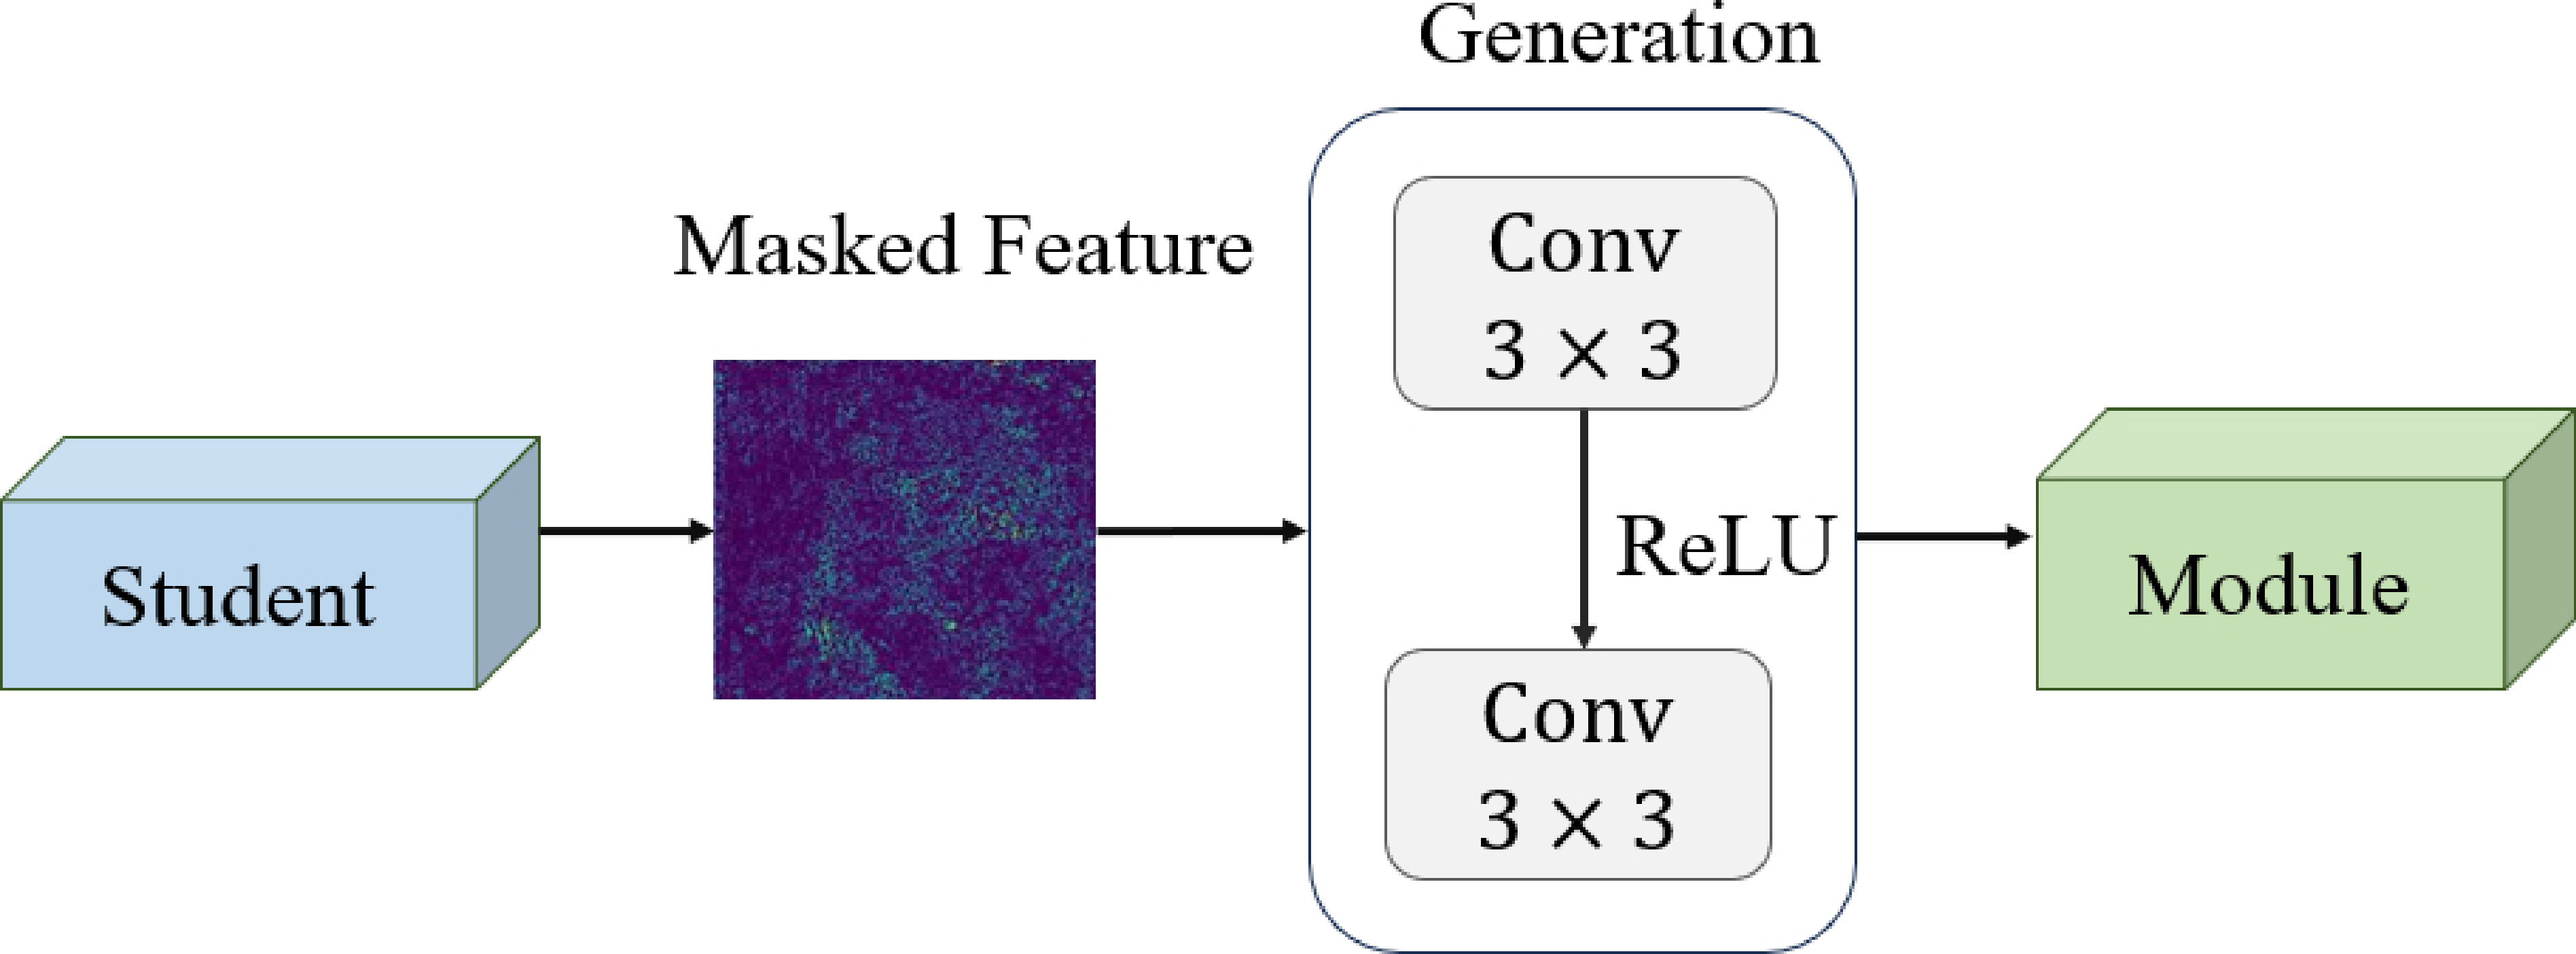
In the framework of reverse knowledge distillation, the student network is tasked with acquiring feature representations from the teacher network. Nevertheless, when faced with a large amount of similar information, the student network faces challenges in identifying key information. Although we have introduced an attention mechanism to optimize the learning process, there is still an issue of unbalanced information learning. To address this problem, this paper further introduces the FMM, as shown in Figure 6. The FMM improves the efficiency of local information utilization and enhances the model's sensitivity to anomaly information by randomly masking pixel features within the student network. It then uses a generative module to recover these features, effectively simulating and synthesizing anomalies at the feature level [25].
In the FMM, random masking of all areas of the student network's output features is performed to simulate feature-level anomalies:
where and represent the height and width respectively, symbolizes a random number falling within the range of (0, 1) on the feature image coordinate (). Moreover, stands for the -th random mask designed to encapsulate the -th feature of the student, while signifies the mask rate. Subsequently, this specific mask is applied to conceal the student's feature map with the aim of replicating the teacher's feature map.
where is the student network feature representation, is the final recovered features of . The generative module contains two convolutional layers and , followed by a subsequent activation phase implemented via ReLU. This study applies convolutional layers in the role of the adaptation layer, denoted as , and utilizes convolutional layers as the projector layer and . For the convolutional neural network-based model, the deeper features usually have a larger sensory field and can represent the information of the original input image more comprehensively. Therefore, even if some pixels are masked, the complete feature map can be recovered from the remaining pixels. The primary goal of the FMM module is to assist the student network in attaining an improved representation by producing features for the teacher network, thus improving its performance in anomaly detection tasks.
3.8 Loss Function
For the design of distillation loss, we refer to the theories of two loss functions, MKD [18] and RD [19]. MKD integrates both the Euclidean metric and cosine similarity within its loss function framework. This hybrid approach capitalizes on the strengths of the cosine similarity method, which is particularly advantageous in traditional knowledge distillation (KD) architectures. RD takes this a step further by advocating for the exclusive use of cosine similarity in its loss function. Empirical evidence from RD suggests that relying solely on cosine similarity can effectively capture and represent the correlations between low-dimensional and high-dimensional feature spaces within the context of reverse knowledge distillation architectures. Building on these insights, the paper in question opts to adopt cosine similarity exclusively as the KD loss function for the T-S model.
For a given image , multi-layer intermediate features are first extracted from the first three residual stages of the pre-trained WideResNet50 teacher network. Then, is encoded into compact features via the bottleneck module. Next, the student network generates the corresponding feature mapping based on , which is followed by outputting the features via the mask generation module. To quantify the similarity between the features of the teacher network and the student network, we use the vector cosine distance as the loss function for training, and generate a two-dimensional anomaly score map at each level of scale:
where stands for the height of the feature map, represents its width. Meanwhile, signifies the feature vector of the -th layer of the teacher network at a specific location on the map, while represents the feature vector yielded by the FMM at that same point. To handle the differing sizes of the feature maps at each level, a mean compression method is used to compress the 2D anomaly maps at each level into a scalar and accumulated to obtain the loss function :
Since deeper key layers will lose more local information, the first 3 key layers of WideResNet50 are selected in the paper, which contain low-dimensional structural and high-dimensional semantic information.
4. Experiments and Discussions
4.1 Dataset and Assessment Metrics
The experiments were conducted predominantly using the MVTec AD dataset [26], housing 5354 images showcasing industrial products across 5 texture categories and 10 object categories.The abnormal areas in the dataset are accurately labeled and contain pixelated labels for 70 different types of abnormal defects. Within the dataset, training solely consists of normal samples, whereas the test set features a mix of normal and abnormal samples.
To thoroughly assess the model's effectiveness, we utilize both image-level and pixel-level metrics based on AUROC. The image-level AUROC represents a key indicator of the model's general anomaly detection proficiency, whereas the pixel-level AUROC emphasizes the model's accuracy in pinpointing anomalies. Furthermore, PRO [7] acts as an additional metric, offering a more detailed evaluation of the model's anomaly localization capabilities.
4.2 Experimental Parameterization
The study was carried out in a setting furnished with Ubuntu 20.04 OS, an RTX 3090 GPU, PyTorch 1.10.0, and the CUDA 11.3 framework. Raw images were preprocessed and uniformly resized to pixels. The architecture incorporates WideResNet50 as the foundational network.
To bolster the model's generalization and prevent overfitting, we integrated a suite of regularization strategies. The Adam optimizer was employed with an initial learning rate of 1e-3, alongside a batch size of 16. Early stopping was implemented to halt training if validation loss stagnated for a set number of epochs, thus avoiding excessive adaptation to training data. Additionally, we add L2 regularization to prevent the model from overfitting:
where is the weight of the th parameter of the model, is the total number of parameters, is the regularization coefficient. The model underwent training for 200 epochs.
4.3 Comparison Experiments
We performed comparative experiments with our proposed method and several mainstream anomaly detection algorithms on the MVTec AD dataset. The algorithms selected for comparison include SSIM and AE-L2 [27], AnoGAN [15], MKD [18], SPADE [28], top-K-M [40], Patch-SVDD [29], PaDiM [30], STPM [31], CutPaste [32], DRAEM [33], RD [19], RecDMs [38], and CA-AE [39], which serve as our baselines.
| Category/Method | SSIM-AE | AnoGAN | MKD | SPADE | top-K-M | Patch-SVDD | PaDiM | STPM | CutPaste | DRAEM | RD | RecDMs | CA-AE | Ours | |
| Textures | Carpet | 67 | 49 | 79.3 | 92.8 | 89.4 | 92.9 | 99.8 | – | 93.9 | 97 | 98.9 | 94.8 | 85 | 99.8 |
| Grid | 69 | 51 | 78 | 47.3 | 96.8 | 94.6 | 96.7 | – | 100 | 99.9 | 100 | 99.5 | 89.6 | 100 | |
| Leather | 46 | 52 | 95.1 | 95.4 | 88.7 | 90.9 | 100 | – | 100 | 100 | 100 | 100 | 92 | 100 | |
| Tile | 52 | 51 | 91.6 | 96.5 | 97.8 | 97.8 | 98.1 | – | 94.6 | 99.6 | 99.3 | 99.8 | 92.8 | 99.8 | |
| Wood | 83 | 68 | 94.3 | 95.8 | 92.6 | 96.5 | 99.2 | – | 99.1 | 99.1 | 99.2 | 99.6 | 95.3 | 99.3 | |
| Objects | Bottle | 88 | 69 | 99.4 | 97.2 | 95.7 | 98.6 | 99.9 | – | 98.2 | 99.2 | 100 | 98.8 | 94 | 100 |
| Cable | 61 | 53 | 89.2 | 84.8 | 60.8 | 90.3 | 92.7 | – | 81.2 | 91.8 | 95 | 92.1 | 93 | 97.2 | |
| Capsule | 61 | 61 | 80.5 | 89.7 | 74.3 | 76.7 | 91.3 | – | 98.2 | 98.5 | 96.3 | 97.9 | 83.7 | 98.7 | |
| Hazelnut | 54 | 50 | 98.4 | 88.1 | 97.2 | 92 | 92 | – | 98.3 | 100 | 99.9 | 98.9 | 100 | 100 | |
| Metal nut | 54 | 50 | 73.6 | 71 | 73.4 | 94 | 98.7 | – | 99.9 | 98.7 | 100 | 96.6 | 89.5 | 100 | |
| Pill | 60 | 62 | 82.7 | 80.1 | 52.5 | 86.1 | 93.3 | – | 94.9 | 98.9 | 96.6 | 95.3 | 86.3 | 97.3 | |
| Screw | 51 | 35 | 83.3 | 66.7 | 84.4 | 81.3 | 85.8 | – | 88.7 | 93.9 | 97 | 99.8 | 100 | 98.7 | |
| Toothbrush | 74 | 57 | 92.2 | 88.9 | 89.8 | 100 | 96.1 | – | 99.4 | 100 | 99.5 | 96.3 | 93.2 | 100 | |
| Transistor | 52 | 67 | 85.6 | 90.3 | 74.6 | 91.5 | 97.4 | – | 96.1 | 93.1 | 96.7 | 99.5 | 86.8 | 98.1 | |
| Zipper | 80 | 59 | 93.2 | 96.6 | 91.8 | 97.9 | 90.3 | – | 99.9 | 100 | 98.5 | 98.8 | 89.7 | 98.2 | |
| Mean | 63 | 55 | 87.8 | 85.4 | 84 | 92.1 | 95.5 | 95.5 | 96.1 | 98 | 98.5 | 98.1 | 91.2 | 99.1 | |
Table 1 records the AUROC scores at the image level, with the most outstanding results for particular categories emphasized in bold print. Our approach consistently delivered the top or second-best detection performance across all categories, with an overall AUROC reaching 99.1%, indicating the proposed method's good adaptability to different objects, shapes, and texture variations.
| Category/Method | OCGAN | LSA | CAVGA-D | US | AnoGAN | GT | MKD | |
|---|---|---|---|---|---|---|---|---|
| Airplane | 75.7 | 73.5 | 65.3 | 78.9 | 67.1 | 76.2 | 90.5 | Ours |
| Car | 53.1 | 58 | 78.4 | 84.9 | 54.7 | 84.8 | 89.1 | 93.1 |
| Bird | 64 | 69 | 76.1 | 73.4 | 52.9 | 77.1 | 80 | 93.8 |
| Cat | 63 | 54.2 | 74.7 | 74.8 | 54.5 | 73.2 | 76.7 | 82.1 |
| Deer | 72.3 | 76.1 | 77.5 | 85.1 | 65.1 | 82.8 | 87.1 | 81.2 |
| Dog | 62 | 54.6 | 55.2 | 79.3 | 60.3 | 84.8 | 91.8 | 91.6 |
| Frog | 72.3 | 75.1 | 81.3 | 89.2 | 58.5 | 82 | 89.3 | 93 |
| Horse | 57.5 | 53.5 | 74.5 | 83 | 62.5 | 88.7 | 86.1 | 93.8 |
| Ship | 82 | 71.7 | 80.1 | 86.2 | 75.8 | 89.5 | 91.6 | 95.4 |
| Truck | 55.4 | 54.8 | 74.1 | 84.8 | 66.5 | 83.4 | 88.7 | 90.5 |
| Mean | 65.7 | 64.1 | 73.7 | 82 | 61.8 | 82.3 | 87.1 | 90.9 |
In order to further evaluate the effectiveness and generality of the proposed method, the defect detection is carried out on the CIFAR-10 dataset and compared with seven related methods: OCGAN [34], LSA [35], CAVGA-D [36], US [7], AnoGAN [15], GT [37] and MKD [18]. The experimental results are shown in Table 2. The AUROC value reaches 90.9%, which is 4 percentage points higher than that of MKD, and achieves the best results in all categories.
| Category/Method | L2-AE | SSIM-AE | AnoGAN | MKD | SPADE | Patch-SVDD | PaDiM | CutPaste | STPM | DRAEM | RD | RecDMs | CA-AE | Ours | |
| Textures | Carpet | 59/45.6 | 87/64.7 | 54/20.4 | 95.6/- | 97.5/94.7 | 98.1/- | 99.1/96.2 | 98.3/- | 98.8/95.8 | 95.5/- | 98.9/97.0 | 96.1/- | 88.4/88.0 | 99.3/98.1 |
| Grid | 90/58.2 | 94/84.9 | 58/22.6 | 91.8/- | 93.7/86.7 | 96.8/- | 97.3/94.6 | 97.5/- | 99/96.6 | 99.7/- | 99.3/97.6 | 93.4/- | 97.2/96.3 | 99.5/97.7 | |
| Leather | 75/81.9 | 78/56.1 | 64/37.8 | 98.1/- | 97.6/97.2 | 95.8/- | 99.2/97.8 | 99.5/- | 99.3/98 | 98.6/- | 99.4/99.1 | 99.6/- | 96.6/95.0 | 99.5/99.3 | |
| Tile | 59/89.7 | 59/17.5 | 50/17.7 | 82.8/- | 87.4/75.9 | 92.6/- | 94.1/86.0 | 90.5/- | 97.4/92.1 | 99.2/- | 95.6/90.6 | 93.5/- | 92.8/93.4 | 97.9/92.8 | |
| Wood | 73/72.7 | 30/60.5 | 62/38.6 | 84.8/- | 88.5/87.4 | 96.2/- | 94.9/91.1 | 95.5/- | 97.2/93.6 | 96.4/- | 95.3/90.9 | 94.7/- | 91.4/90.0 | 96.6/92.9 | |
| Objects | Bottle | 86/91.0 | 93/83.4 | 86/62.0 | 96.3/- | 98.4/95.5 | 97.6/- | 98.3/94.8 | 97.6/- | 98.8/95.1 | 99.1/- | 98.7/96.6 | 94.3/- | 95.1/92.1 | 98.9/97.8 |
| Cable | 86/82.5 | 82/47.8 | 78/38.3 | 82.4/- | 97.2/90.9 | 97.4/- | 96.7/88.8 | 90.0/- | 95.5/87.8 | 94.7/- | 97.4/91 | 94.7/- | 92.6/91.4 | 98.1/94.3 | |
| Capsule | 88/86.2 | 94/86.0 | 84/30.6 | 95.9/- | 99.0/93.7 | 98.0/- | 98.5/93.5 | 97.4/- | 98.3/92.2 | 94.3/- | 98.7/95.8 | 97.2/- | 93.1/92.2 | 98.8/96.1 | |
| Hazelnut | 95/91.7 | 97/91.6 | 87/69.8 | 94.6/- | 99.1/95.4 | 95.1/- | 98.2/92.6 | 97.3/- | 98.5/94.3 | 99.7/- | 98.9/95.5 | 95.0/- | 98.2/99.0 | 99.1/96.7 | |
| Metal nut | 86/83.0 | 89/60.3 | 76/32.0 | 86.4/- | 98.1/94.4 | 95.7/- | 97.2/85.6 | 93.1/- | 97.6/94.5 | 99.5/- | 97.3/92.3 | 92.7/- | 91.0/89.0 | 98.4/93 | |
| Pill | 91/89.3 | 91/83.0 | 87/77.6 | 89.6/- | 96.5/94.6 | 91.4/- | 95.7/92.7 | 95.7/- | 97.8/96.5 | 97.6/- | 98.2/96.4 | 95.6/- | 92.6/93.2 | 98.5/96.6 | |
| Screw | 96/75.4 | 96/88.7 | 80/46.6 | 96.0/- | 98.9/96.0 | 98.1/- | 98.5/94.4 | 96.7/- | 98.3/93 | 97.6/- | 99.6/98.2 | 93.9/- | 97.7/100 | 99.6/98.5 | |
| Toothbrush | 93/82.2 | 92/78.4 | 93/74.9 | 96.1/- | 97.9/93.5 | 97.0/- | 98.8/93.1 | 98.1/- | 98.9/92.2 | 98.1/- | 99.1/94.5 | 97.2/- | 89.4/90.5 | 99.2/96.3 | |
| Transistor | 86/72.8 | 90/72.5 | 86/54.9 | 76.5/- | 94.1/87.4 | 90.8/- | 97.5/84.5 | 93.0/- | 82.5/69.5 | 90.9/- | 92.5/78 | 86.4/- | 85.0/81.0 | 96.1/93.2 | |
| Zipper | 77/83.9 | 88/66.5 | 78/46.7 | 93.9/- | 96.5/92.6 | 95.1/- | 98.5/95.9 | 99.3/- | 98.5/95.2 | 98.8/- | 98.2/95.4 | 88.5/- | 93.2/94.0 | 99.2/96.5 | |
| Mean | 82.7/79.0 | 87/69.4 | 74/44.3 | 90.7/- | 96.0/91.7 | 95.7/- | 97.5/92.1 | 96.0/- | 96.5/92.1 | 97.3/- | 97.8/93.9 | 94.6/- | 93.0/92.3 | 98.5/95.9 | |
Table 3 illustrates the efficacy of anomaly localization. The findings from the experiments demonstrate that the proposed approach outperforms other methods with an average AUROC value of 98.5%, and the AUROC of all 13 classes is more than 98%, highlighting its robustness in detecting diverse anomalies. Furthermore, from the PRO point of view, especially on the transistor class, the method in this paper improves 15.2% over RD. Although the image reconstruction-based DRAEM method performs well on some specific object data, its dependence on the information inherited from the trained reconstruction network may lead to a decline in detection performance for other objects. In contrast, our method shows more robust and generalized performance across different scenarios.
4.4 Visualization Results
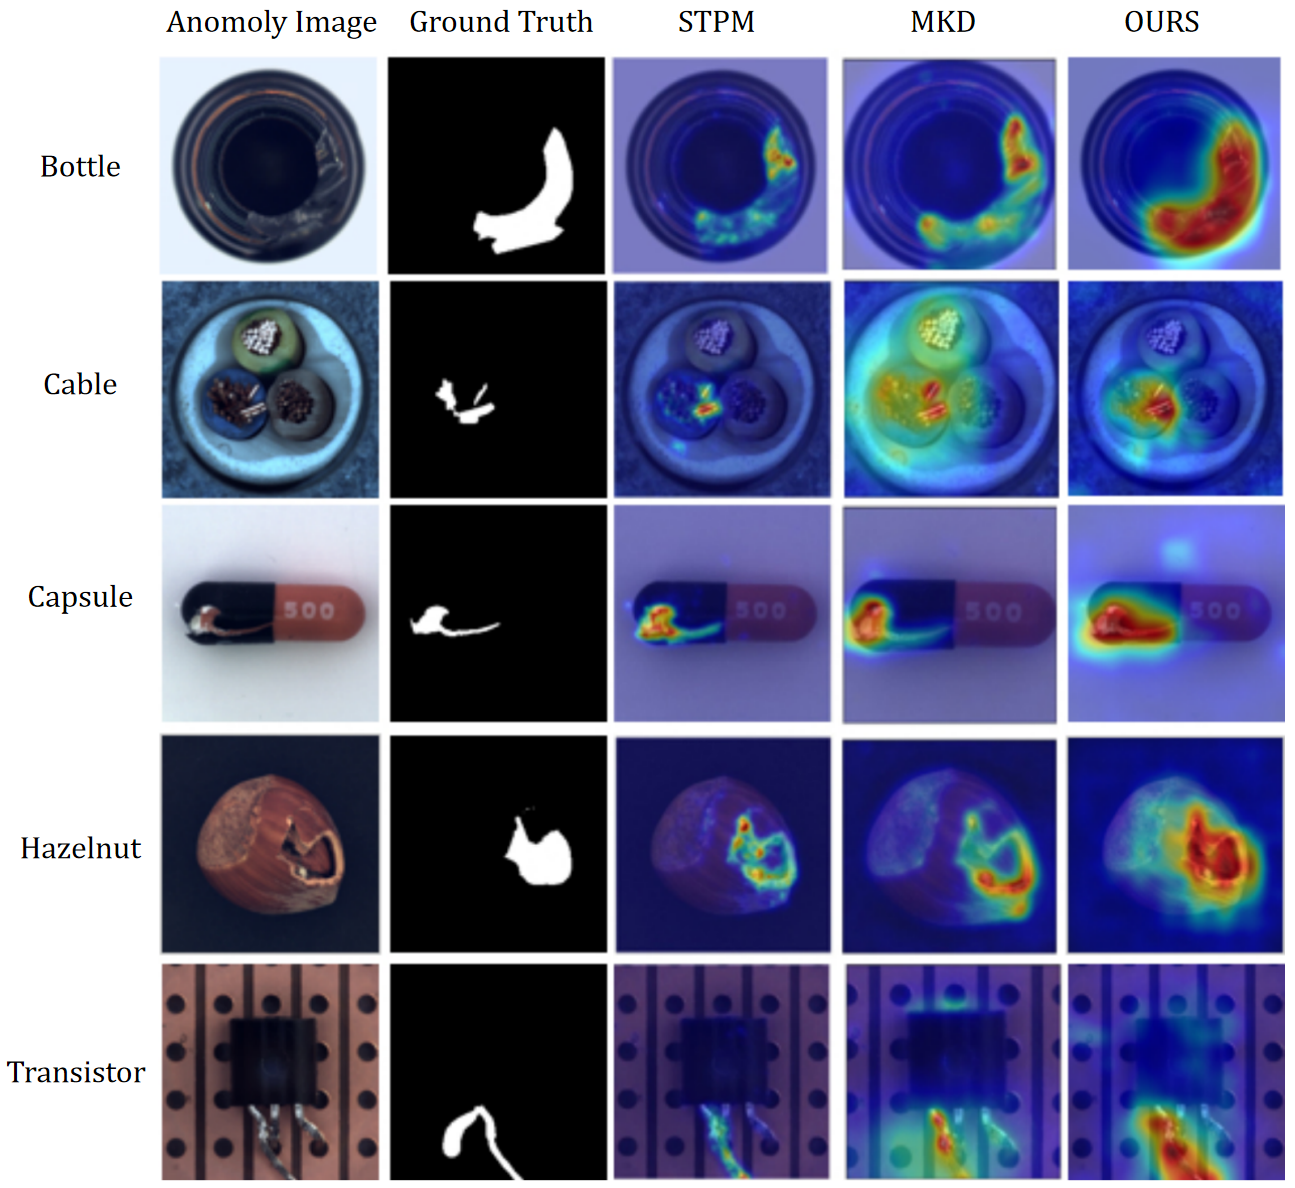
To showcase the effectiveness of our approach in pinpointing anomalies, we opted to contrast it with STPM and MKD, culminating in the illustration of anomaly localization in Figure 7. The results vividly display the precision of our model in identifying anomalies. When it comes to selecting the backbone network, STPM [29] employs ResNet18 and MKD [32] utilizes VGG16, whereas our study harnesses the more potent feature extraction abilities of WideResNet50. In detection methods rooted in knowledge distillation, the feature extraction prowess of the teacher network significantly impacts the detection outcomes of the model. In addition, as described in 3.2, the reverse distillation architecture method used in this paper avoids the accuracy issues caused by insufficient representation of anomaly samples to a certain extent.
4.5 Ablation Experiments
4.5.1 Backbones
In our investigation of the primary network structure, we employed ResNet18, ResNet50, and WideResNet50 as backbone networks to evaluate their influence on model precision, detailed in Table 4. Our findings demonstrate that as the network's depth and breadth expand, it becomes capable of extracting more sophisticated semantic characteristics, thereby improving the model's discriminative performance and anomaly detection capability. Especially when using WideResNet50, the model achieved the highest accuracy. It is worth noting that even when using the smaller-scale ResNet18, the method still demonstrated excellent performance.
| Backbones | AUROCAD | AUROCAl | PRO |
|---|---|---|---|
| RestNet18 | 98.2 | 97.3 | 94.4 |
| RestNet50 | 98.8 | 98.2 | 95.2 |
| WideRestNet50 | 99.1 | 98.5 | 95.9 |
4.5.2 FMM
To verify the effectiveness of FMM, relevant ablation tests were carried out, with the findings outlined in Table 5. FMM boosts the capacity of the student network to grasp feature representations by restoring feature-level anomalies, thereby enabling it to encompass finer pixel intricacies crucial for enhancing feature restoration. This method improves the expressiveness of detailed information and ultimately enhances the accuracy of restored features.
| Baseline | FMM | AUROCAl | AUROCAl | PRO |
|---|---|---|---|---|
| 98.8 | 98.1 | 95.3 | ||
| 99.1 | 98.5 | 95.9 |
4.5.3 Scsatt
To verify the effectiveness of SCConv and SimAM on the bottleneck module, ablation experiments were carried out, with the outcomes detailed in Table 6. The inclusion of an attention mechanism can enhance the model's performance to some degree, and after adding both module, the improvement in image anomaly detection results is more significant. The AUROC values at both image and pixel levels saw an increase of 0.6 and 0.7, respectively. The experimental findings indicate that the SCSAtt mechanism adeptly filters and selects input data, thereby improving the accuracy of anomaly detection.
| Baseline | SimAM | SCConv | AUROCAD | AUROCAl | PRO |
|---|---|---|---|---|---|
| 98.5 | 97.8 | 93.9 | |||
| 98.6 | 98 | 95.5 | |||
| 99.1 | 98.2 | 95.3 | |||
| 99.1 | 98.5 | 95.9 |
4.5.4 Multi-scale Feature Map
In terms of feature fusion, the impact of feature , , and from different layers of the teacher network on the accuracy of the model was explored, and the results are shown in Table 7. The analysis revealed that the features from the second layer obtained by the teacher model demonstrated superior performance, primarily because they encompassed both local texture and the overall structural details. Given the diversity of anomaly types in the dataset, a single layer of features cannot fully detect all types of anomalies. In contrast, the effects of two-feature fusion and three-feature fusion are both better than a single layer of features, underscoring the significance of multi-scale feature integration in capturing diverse anomaly categories. The study validates that merging high-level and low-level features enriches semantic content, enhances detection precision, and equips the model with a more holistic portrayal of the input data.
| Feature Map | AUROCAd | AUROCA | PRO | ||
|---|---|---|---|---|---|
| 96.5 | 97.1 | 92.2 | |||
| 96.3 | 97.4 | 92.8 | |||
| 93.9 | 94.2 | 91.3 | |||
| 98 | 97.4 | 94.8 | |||
| 98.4 | 97.5 | 95.3 | |||
| 97.9 | 97.1 | 94.4 | |||
| 99.1 | 98.5 | 95.9 | |||
5. Conclusion
This study presents a novel unsupervised anomaly detection approach utilizing an enhanced reverse knowledge distillation framework. Traditional methods employing knowledge distillation encounter a couple of challenges. First, the model's training exclusively on normal data can result in the student model acquiring an overly robust generalization capability, miscategorizing abnormal attributes as normal. Second, the convolutional compression process may cause multi-scale features produced during training to become distorted, hindering the comprehensive utilization of information. The proposed method addresses these issues by designing different data flows for the T-S network, enhancing the model's expression of anomalies; at the same time, the SCSAtt and FMM modules are designed to strengthen the correlation between pixels, making the localization more accurate. On the MVTec AD dataset, the proposed method has shown better performance in anomaly localization.
While this paper has indeed improved the student network's learning from the teacher network, there is still potential for enhancing the precision of the knowledge transfer process. Subsequent research could delve deeper into refining model architecture and integrating new data augmentation techniques to bolster the framework's ability to detect anomalies.
Data Availability Statement
Funding
Conflicts of Interest
Ethical Approval and Consent to Participate
References
- Ruff, L., Kauffmann, J. R., Vandermeulen, R. A., Montavon, G., Samek, W., Kloft, M., ... & Müller, K. R. (2021). A unifying review of deep and shallow anomaly detection. Proceedings of the IEEE, 109(5), 756-795.
- Li, Z., Wang, C., Han, M., Xue, Y., Wei, W., Li, L. J., & Fei-Fei, L. (2018). Thoracic disease identification and localization with limited supervision. In Proceedings of the IEEE conference on computer vision and pattern recognition (pp. 8290-8299).
- Lin, D., Li, Y., Prasad, S., Nwe, T. L., Dong, S., & Oo, Z. M. (2021). CAM-guided Multi-Path Decoding U-Net with Triplet Feature Regularization for defect detection and segmentation. Knowledge-Based Systems, 228, 107272.
- Luo, J., Yang, Z., Li, S., & Wu, Y. (2021). FPCB surface defect detection: A decoupled two-stage object detection framework. IEEE Transactions on Instrumentation and Measurement, 70, 1-11.
- Chen, F., Wang, W., Yang, H., Pei, W., & Lu, G. (2022). Multiscale feature fusion for surveillance video diagnosis. Knowledge-Based Systems, 240, 108103.
- Niu, S., Li, B., Wang, X., & Peng, Y. (2021). Region-and strength-controllable GAN for defect generation and segmentation in industrial images. IEEE Transactions on Industrial Informatics, 18(7), 4531-4541.
- Bergmann, P., Fauser, M., Sattlegger, D., & Steger, C. (2020). Uninformed students: Student-teacher anomaly detection with discriminative latent embeddings. In Proceedings of the IEEE/CVF conference on computer vision and pattern recognition (pp. 4183-4192).
- Atlason, H. E., Love, A., Sigurdsson, S., Gudnason, V., & Ellingsen, L. M. (2019, March). Unsupervised brain lesion segmentation from MRI using a convolutional autoencoder. In Medical Imaging 2019: Image Processing (Vol. 10949, pp. 372-378). SPIE.
- Zhao, R., Yan, R., Chen, Z., Mao, K., Wang, P., & Gao, R. X. (2019). Deep learning and its applications to machine health monitoring. Mechanical Systems and Signal Processing, 115, 213-237.
- Kingma, D. P., & Welling, M. (2013, December). Auto-encoding variational bayes.
- Goodfellow, I. J., Pouget-Abadie, J., Mirza, M., Xu, B., Warde-Farley, D., Ozair, S., ... & Bengio, Y. (2014). Generative adversarial nets. Advances in neural information processing systems, 27.
- Kwon, G., Prabhushankar, M., Temel, D., & AlRegib, G. (2020, August). Backpropagated gradient representations for anomaly detection. In European conference on computer vision (pp. 206-226). Cham: Springer International Publishing.
- Chu, W. H., & Kitani, K. M. (2020, August). Neural batch sampling with reinforcement learning for semi-supervised anomaly detection. In European conference on computer vision (pp. 751-766). Cham: Springer International Publishing.
- Kim, D., Jeong, D., Kim, H., Chong, K., Kim, S., & Cho, H. (2022). Spatial contrastive learning for anomaly detection and localization. IEEE Access, 10, 17366-17376.
- Schlegl, T., Seeböck, P., Waldstein, S. M., Schmidt-Erfurth, U., & Langs, G. (2017). Unsupervised anomaly detection with generative adversarial networks to guide marker discovery. In M. Niethammer, et al. (Eds.), Information processing in medical imaging: IPMI 2017 (Lecture Notes in Computer Science, Vol. 10265, pp. 146–157). Springer.
- Akcay, S., Atapour-Abarghouei, A., & Breckon, T. P. (2018, December). Ganomaly: Semi-supervised anomaly detection via adversarial training. In Asian conference on computer vision (pp. 622-637). Cham: Springer International Publishing.
- Schlegl, T., Seeböck, P., Waldstein, S. M., Langs, G., & Schmidt-Erfurth, U. (2019). f-AnoGAN: Fast unsupervised anomaly detection with generative adversarial networks. Medical image analysis, 54, 30-44.
- Salehi, M., Sadjadi, N., Baselizadeh, S., Rohban, M. H., & Rabiee, H. R. (2021). Multiresolution knowledge distillation for anomaly detection. In Proceedings of the IEEE/CVF conference on computer vision and pattern recognition (pp. 14902-14912).
- Deng, H., & Li, X. (2022). Anomaly detection via reverse distillation from one-class embedding. In Proceedings of the IEEE/CVF conference on computer vision and pattern recognition (pp. 9737-9746).
- He, K., Zhang, X., Ren, S., & Sun, J. (2016). Deep residual learning for image recognition. In Proceedings of the IEEE conference on computer vision and pattern recognition (pp. 770-778).
- Zagoruyko, S., & Komodakis, N. (2016). Wide residual networks. arXiv preprint arXiv:1605.07146.
- Deng, J., Dong, W., Socher, R., Li, L. J., Li, K., & Fei-Fei, L. (2009, June). Imagenet: A large-scale hierarchical image database. In 2009 IEEE conference on computer vision and pattern recognition (pp. 248-255). Ieee.
- Li, J., Wen, Y., & He, L. (2023). Scconv: Spatial and channel reconstruction convolution for feature redundancy. In Proceedings of the IEEE/CVF conference on computer vision and pattern recognition (pp. 6153-6162).
- Yang, L., Zhang, R. Y., Li, L., & Xie, X. (2021, July). Simam: A simple, parameter-free attention module for convolutional neural networks. In International conference on machine learning (pp. 11863-11874). PMLR.
- Yang, Z., Li, Z., Shao, M., Shi, D., Yuan, Z., & Yuan, C. (2022, October). Masked generative distillation. In European conference on computer vision (pp. 53-69). Cham: Springer Nature Switzerland.
- Bergmann, P., Fauser, M., Sattlegger, D., & Steger, C. (2019). MVTec AD--A comprehensive real-world dataset for unsupervised anomaly detection. In Proceedings of the IEEE/CVF conference on computer vision and pattern recognition (pp. 9592-9600).
- Aytekin, C., Ni, X., Cricri, F., & Aksu, E. (2018, July). Clustering and unsupervised anomaly detection with l 2 normalized deep auto-encoder representations. In 2018 International Joint Conference on Neural Networks (IJCNN) (pp. 1-6). IEEE.
- Cohen, N., & Hoshen, Y. (2020). Sub-image anomaly detection with deep pyramid correspondences. arXiv preprint arXiv:2005.02357.
- Yi, J., & Yoon, S. (2020). Patch svdd: Patch-level svdd for anomaly detection and segmentation. In Proceedings of the Asian conference on computer vision.
- Defard, T., Setkov, A., Loesch, A., & Audigier, R. (2021, January). Padim: a patch distribution modeling framework for anomaly detection and localization. In International conference on pattern recognition (pp. 475-489). Cham: Springer International Publishing.
- Wang, G., Han, S., Ding, E., & Huang, D. (2021). Student-teacher feature pyramid matching for anomaly detection. arXiv preprint arXiv:2103.04257.
- Li, C. L., Sohn, K., Yoon, J., & Pfister, T. (2021). Cutpaste: Self-supervised learning for anomaly detection and localization. In Proceedings of the IEEE/CVF conference on computer vision and pattern recognition (pp. 9664-9674).
- Zavrtanik, V., Kristan, M., & Skočaj, D. (2021). Draem-a discriminatively trained reconstruction embedding for surface anomaly detection. In Proceedings of the IEEE/CVF international conference on computer vision (pp. 8330-8339).
- Perera, P., Nallapati, R., & Xiang, B. (2019). Ocgan: One-class novelty detection using gans with constrained latent representations. In Proceedings of the IEEE/CVF conference on computer vision and pattern recognition (pp. 2898-2906).
- Abati, D., Porrello, A., Calderara, S., & Cucchiara, R. (2019). Latent space autoregression for novelty detection. In Proceedings of the IEEE/CVF Conference on Computer Vision and Pattern Recognition (pp. 481-490).
- Venkataramanan, S., Peng, K. C., Singh, R. V., & Mahalanobis, A. (2020, August). Attention guided anomaly localization in images. In European Conference on Computer Vision (pp. 485-503). Cham: Springer International Publishing.
- Golan, I., & El-Yaniv, R. (2018). Deep anomaly detection using geometric transformations. Advances in neural information processing systems, 31.
- Xu, H., Xu, S., & Yang, W. (2023). Unsupervised industrial anomaly detection with diffusion models. Journal of Visual Communication and Image Representation, 97, 103983.
- Yang, Q., & Guo, R. (2024). An unsupervised method for industrial image anomaly detection with vision transformer-based autoencoder. Sensors, 24(8), 2440.
- Shen, H., Wei, B., Ma, Y., & Gu, X. (2023). Unsupervised industrial image ensemble anomaly detection based on object pseudo-anomaly generation and normal image feature combination enhancement. Computers & Industrial Engineering, 182, 109337.
Cite This Article
Article Metrics
Citations:Article Access Statistics:
Publisher's Note
ICCK stays neutral with regard to jurisdictional claims in published maps and institutional affiliations.
Rights and Permissions

Copyright © 2024 by the Author(s). Published by Institute of Central Computation and Knowledge.
This article is an open access article distributed under the terms and conditions of the Creative Commons Attribution (CC BY) license.