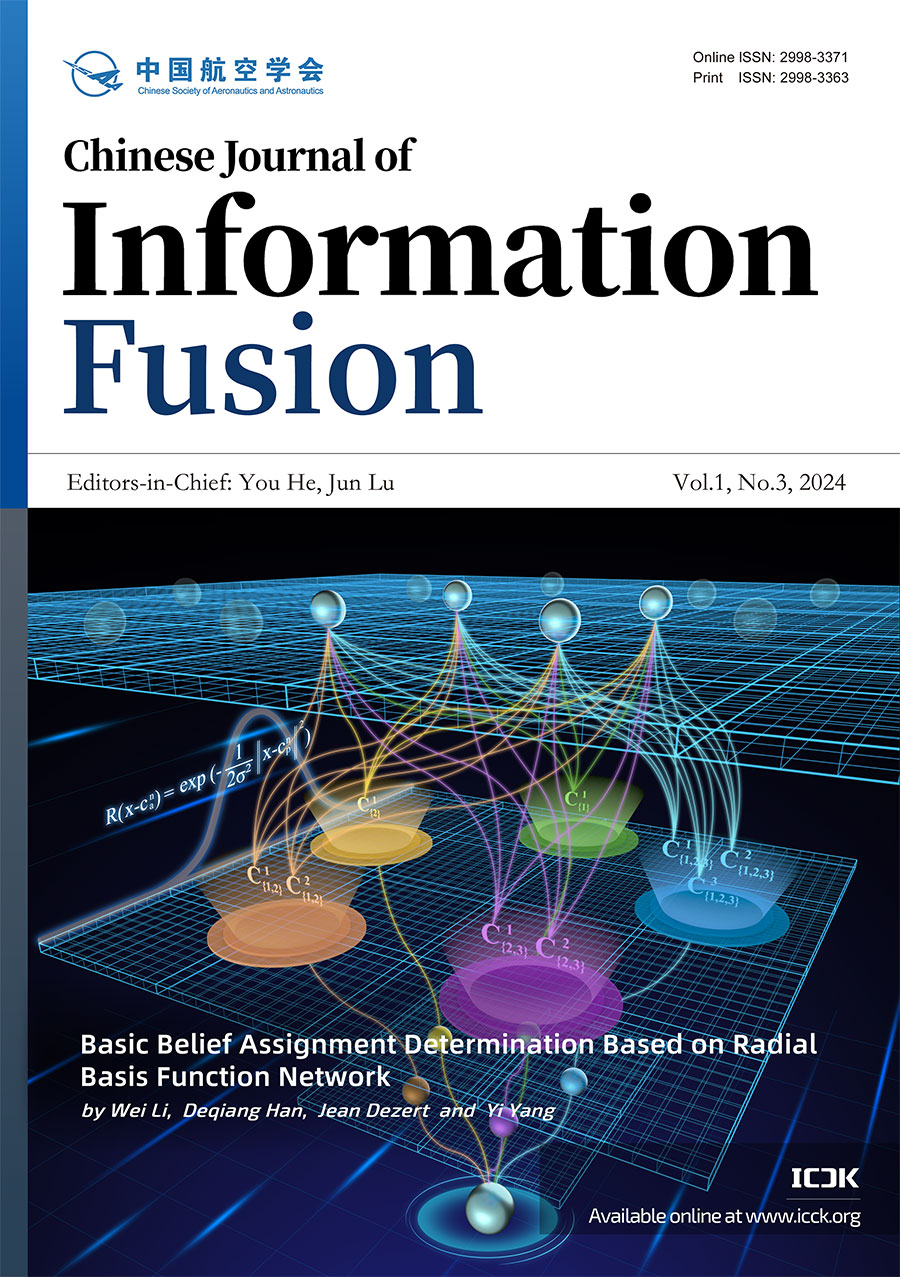
Abstract
Graphical Abstract
Click image to view fullscreen
Keywords
1. Introduction
Dempster-Shafer evidence theory (DST) [1, 2], also known as the theory of belief functions, is an important mathematical framework for uncertainty modeling and reasoning. It has been widely applied in several fields, such as information fusion [3, 4], pattern classification [5, 6], and multi-attribute decision-making [7, 8].
In DST, the determination (or generation) of BBA corresponds to the modeling of uncertainty [9], which currently remains a challenging issue. The methods for determining BBA are often related to the specific applications. For automatic target classification, Selzer et al.[10] proposed a BBA determination method using the class number and the target's neighborhood. Bi et al.[11] proposed a focal element triplet-based method for text classification. Zhang et al.[12] proposed to determine BBA using the evidential Markov random field for the image segmentation problem. For image edge detection, Dezert et al.[13] determined BBA to describe the uncertainty of the chosen threshold. For multi-attribute decision-making, Han et al.[7] determined BBA using the intervals of the expected payoffs for different alternatives.
In addition, some general BBA determination methods have been proposed. Jiang et al.[14] proposed a BBA determination method based on the triangular fuzzy number. Han et al.[15] proposed a method for transforming the fuzzy membership function into BBA using uncertain optimization. Kang et al.[16] proposed an interval number-based BBA determination method.
For BBA determination, the rational mass determina-tion of compound focal elements is crucial for fully taking advantage of DST (i.e., the capability to represent and handle the ambiguity). However, when determining the mass value of compound focal elements, traditional methods are often heuristic and lack sufficient soundness, such as the method using singleton focal elements' complement set [11] or the method using discount to singleton focal elements[17]. In this paper, for the compound focal elements, we first select and construct "compound-class samples", defined as samples with ambiguous class membership. Based on these samples, we construct an end-to-end model called Evidential Radial Basis Function Network (E-RBFN), where the input is the sample and the output is the corresponding BBA. That is, the E-RBFN can directly determine the mass values for all focal elements (including the singleton and compound ones). Experimental results of evidence fusion decision-based pattern classification on multiple UCI and image datasets show that our proposed method performs better than many existing BBA determination methods.
2. Preliminary
2.1 Basics of Dempster Shafer Theory
In DST, the frame of discernment (FOD) is defined as a set consisting of mutually exclusive and exhaustive elements, denoted by . Let be the power set of the FOD . If a set function satisfies
then is called a basic belief assignment (BBA, also called a mass function). is called a focal element of the BBA if and only if .
Given a BBA on the FOD , the belief function and plausibility function are respectively defined as
The and constitute the lower and upper bounds of the belief interval , which represents the degree of imprecision for the proposition .
Suppose that and are two independent BBAs on the same FOD, which can be combined via the Dempster's rule of combination [1] as follows
where is the conflict coefficient between the two BBAs.
The pignistic probability [18] corresponding to a BBA is defined as
where is the cardinality of the focal element . Based on this, one can perform probabilistic decisions according to the decision rule defined as follows.
2.2 Traditional BBA Determination Methods
1) BBA Determination Using Discount to Singletons [17]: Suppose that FOD , given an input sample , the probability for each class is first obtained by a well-trained classifier (such as the fully-connected neural network), represented as . Then, the mass value for each singleton focal element is calculated by applying a discount to the corresponding probability, as shown in Eq. (7).
where is the discount factor designed by users, with values ranging from . Finally, the mass value for the compound focal element is calculated by Eq. (8).
For example, if the FOD , given a test sample, its probabilities corresponding to each class are first obtained using a trained classifier (a fully-connected neural network), represented as .
If the discount factor is set to 0.8, the corresponding BBA for this sample is represented as .
2) BBA Determination Using Tri-Focal Element [11]: Suppose that FOD , given an input sample , the probability for each class is first obtained by a well-trained classifier (such as the fully-connected neural network), represented as . Define the tri-focal element as , where are singleton focal elements, and is compound focal element, defined as
The mass values of and are respectively calculated by Eq.(10).
For example, if the FOD , given a test sample, its probabilities corresponding to each class are first obtained . For the tri-focal element , is defined as . is defined as . is defined as . Then, the mass value of each focal element is calculated as . For the BBA determination, the rational mass determination for compound focal elements is crucial, which is related to fully taking advantage of DST, i.e., the capability to represent ambiguity. However, in the above methods, the mass values of compound focal elements are heuristically determined using the singleton focal elements' mass values (by the complementary set). These approaches lack sufficient witness. To address this, we propose an end-to-end BBA determination method based on a radial basis function network (RBFN), which can directly determine the mass values for all focal elements (including the singleton and compound ones), detailed in Section 3.
3. BBA Determination Based on E-RBFN
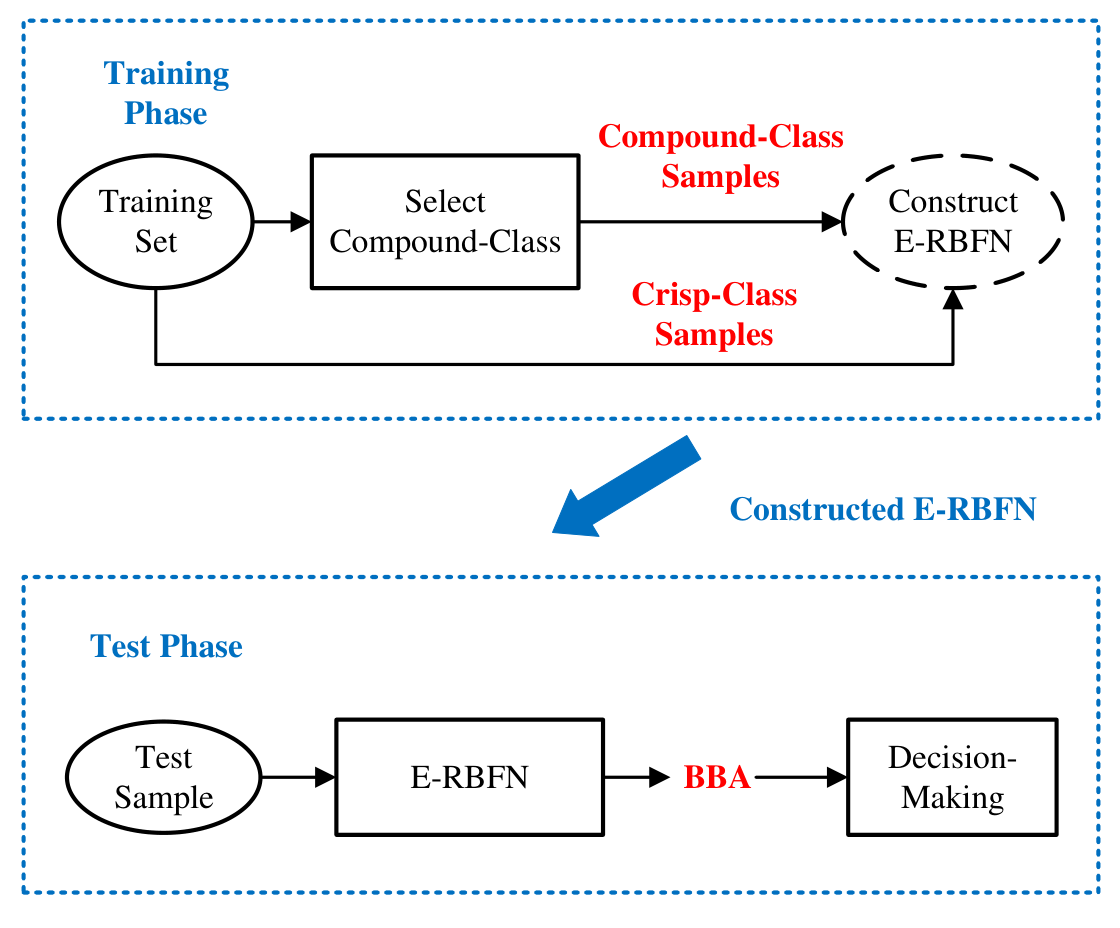
In this paper, we propose to design the BBA determination as an end-to-end model called E-RBFN, with the sample as input and the corresponding BBA as the output. Our proposed method is divided into two parts. First, we select and construct the "compound-class samples" with ambiguous class membership, which corresponds to the compound focal elements in the FOD . Second, we treat the compound classes as new class labels to construct the E-RBFN (together with the crisp classes), thus implementing the mass modeling for all focal elements (including the singleton and compound ones).
3.1 Selection of Compound-Class Samples
Before constructing the E-RBFN, we first select and construct the compound-class samples. In this paper, compound-class samples are defined as samples with ambiguous class membership, which corresponds to compound focal elements in the FOD . For example, if a sample belongs to the compound class , it represents that the sample's class membership is ambiguous between the crisp class and crisp class . In this paper, we propose to use the confusion matrix and the information entropy to select and construct compound-class samples, as shown in Figure 1.
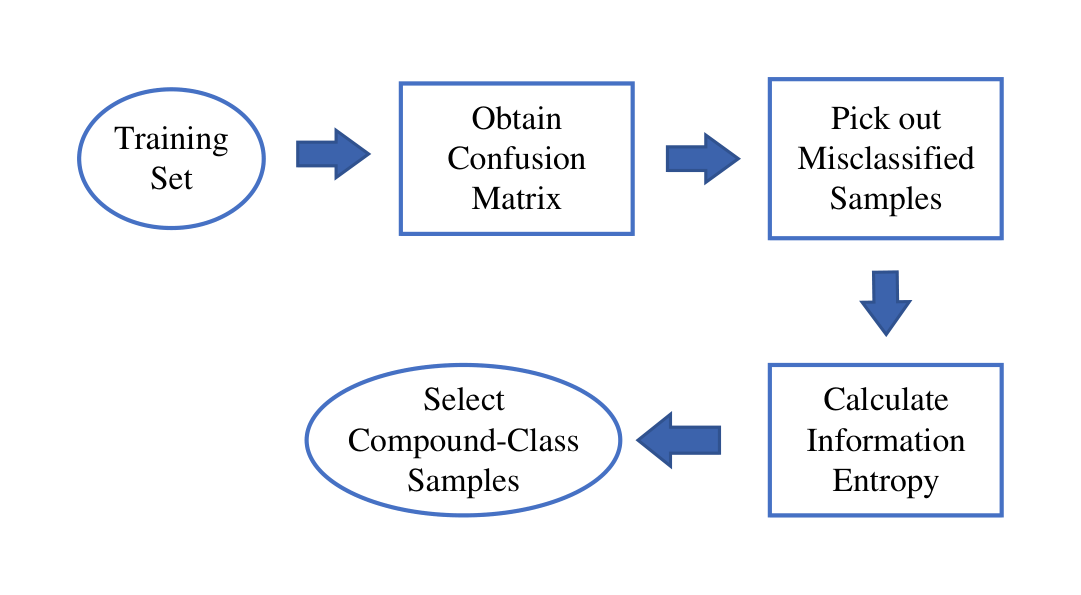
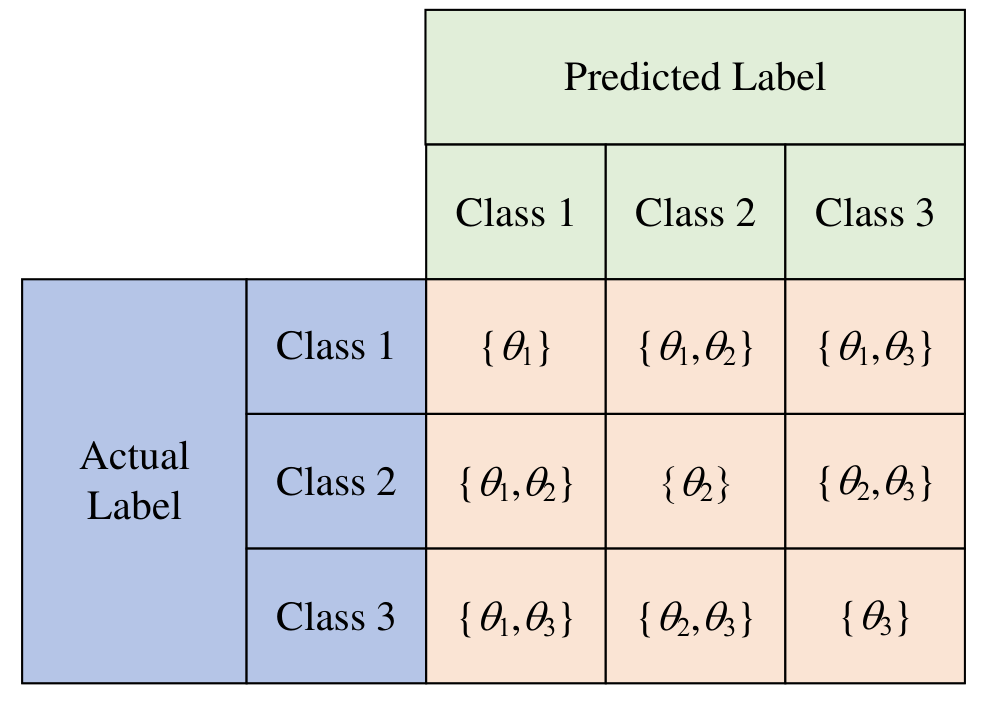
1) Step1-Construct Confusion Matrix: First, we use the cross validation (via the naive Bayesian classifier) to construct confusion matrix. Suppose that FOD , the confusion matrix is shown in Figure 2.
2) Step2-Pick out Misclassified Samples: Based on the confusion matrix, we pick out the misclassified samples to serve as the compound-class samples. Meanwhile, the correctly classified samples are considered as crisp-class samples.
3) Step3-Calculate Information Entropy: To measure the ambiguity of misclassified samples, we calculate the information entropy of each misclassified sample. For a misclassified sample , its information entropy is calculated as follows.
where is the probability for the sample belonging to the crisp class (obtained by the Bayesian classifier). is the total number of the crisp classes. Higher entropy indicates that the probabilities of each class are more similar, implying greater ambiguity.
4) Step4-Select Compound-Class Samples: After calcula-ting the entropy for each misclassified sample, we compare it with a predefined threshold (we set it to 1 for the simplicity; other values can also be used). For a sample misclassified between class 1 and class 2 (as an example), if its entropy exceeds the threshold, this sample is assigned to the total set . If its entropy is less than the threshold, this sample is assigned to the compound class . The illustrative example of the compound-class samples selection is provided in Section 3.3.
3.2 Construction of E-RBFN
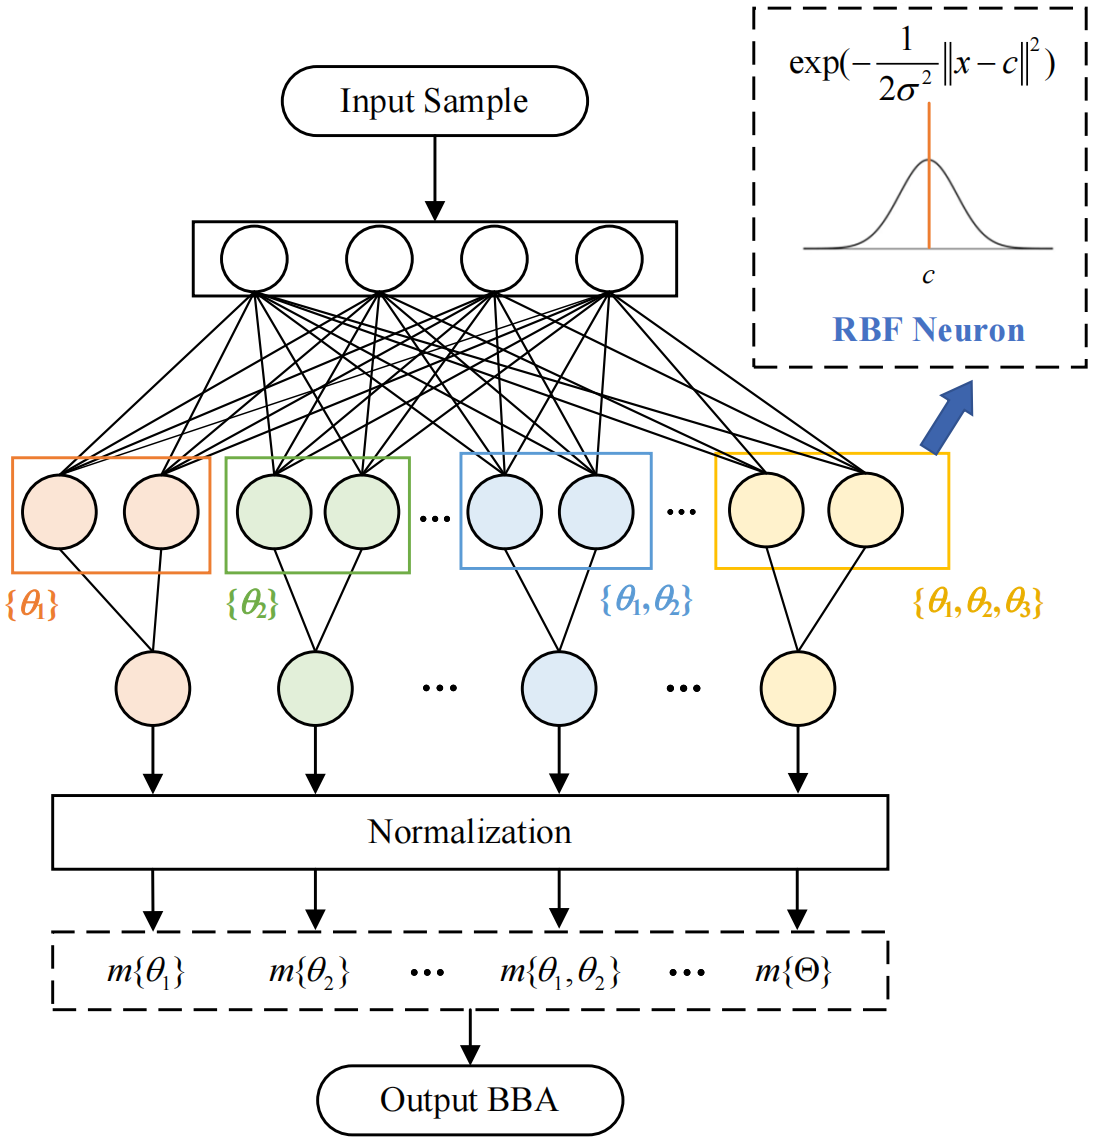
After obtaining the compound-class samples, we treat them as new classes to construct E-RBFN together with crisp-class samples, thus implementing the mass modeling for each focal element (including the compound focal element). For the dataset containing three crisp classes, there are seven class labels: , , , , , and . The structure of E-RBFN is shown in Figure 3. Note that some classes are omitted.
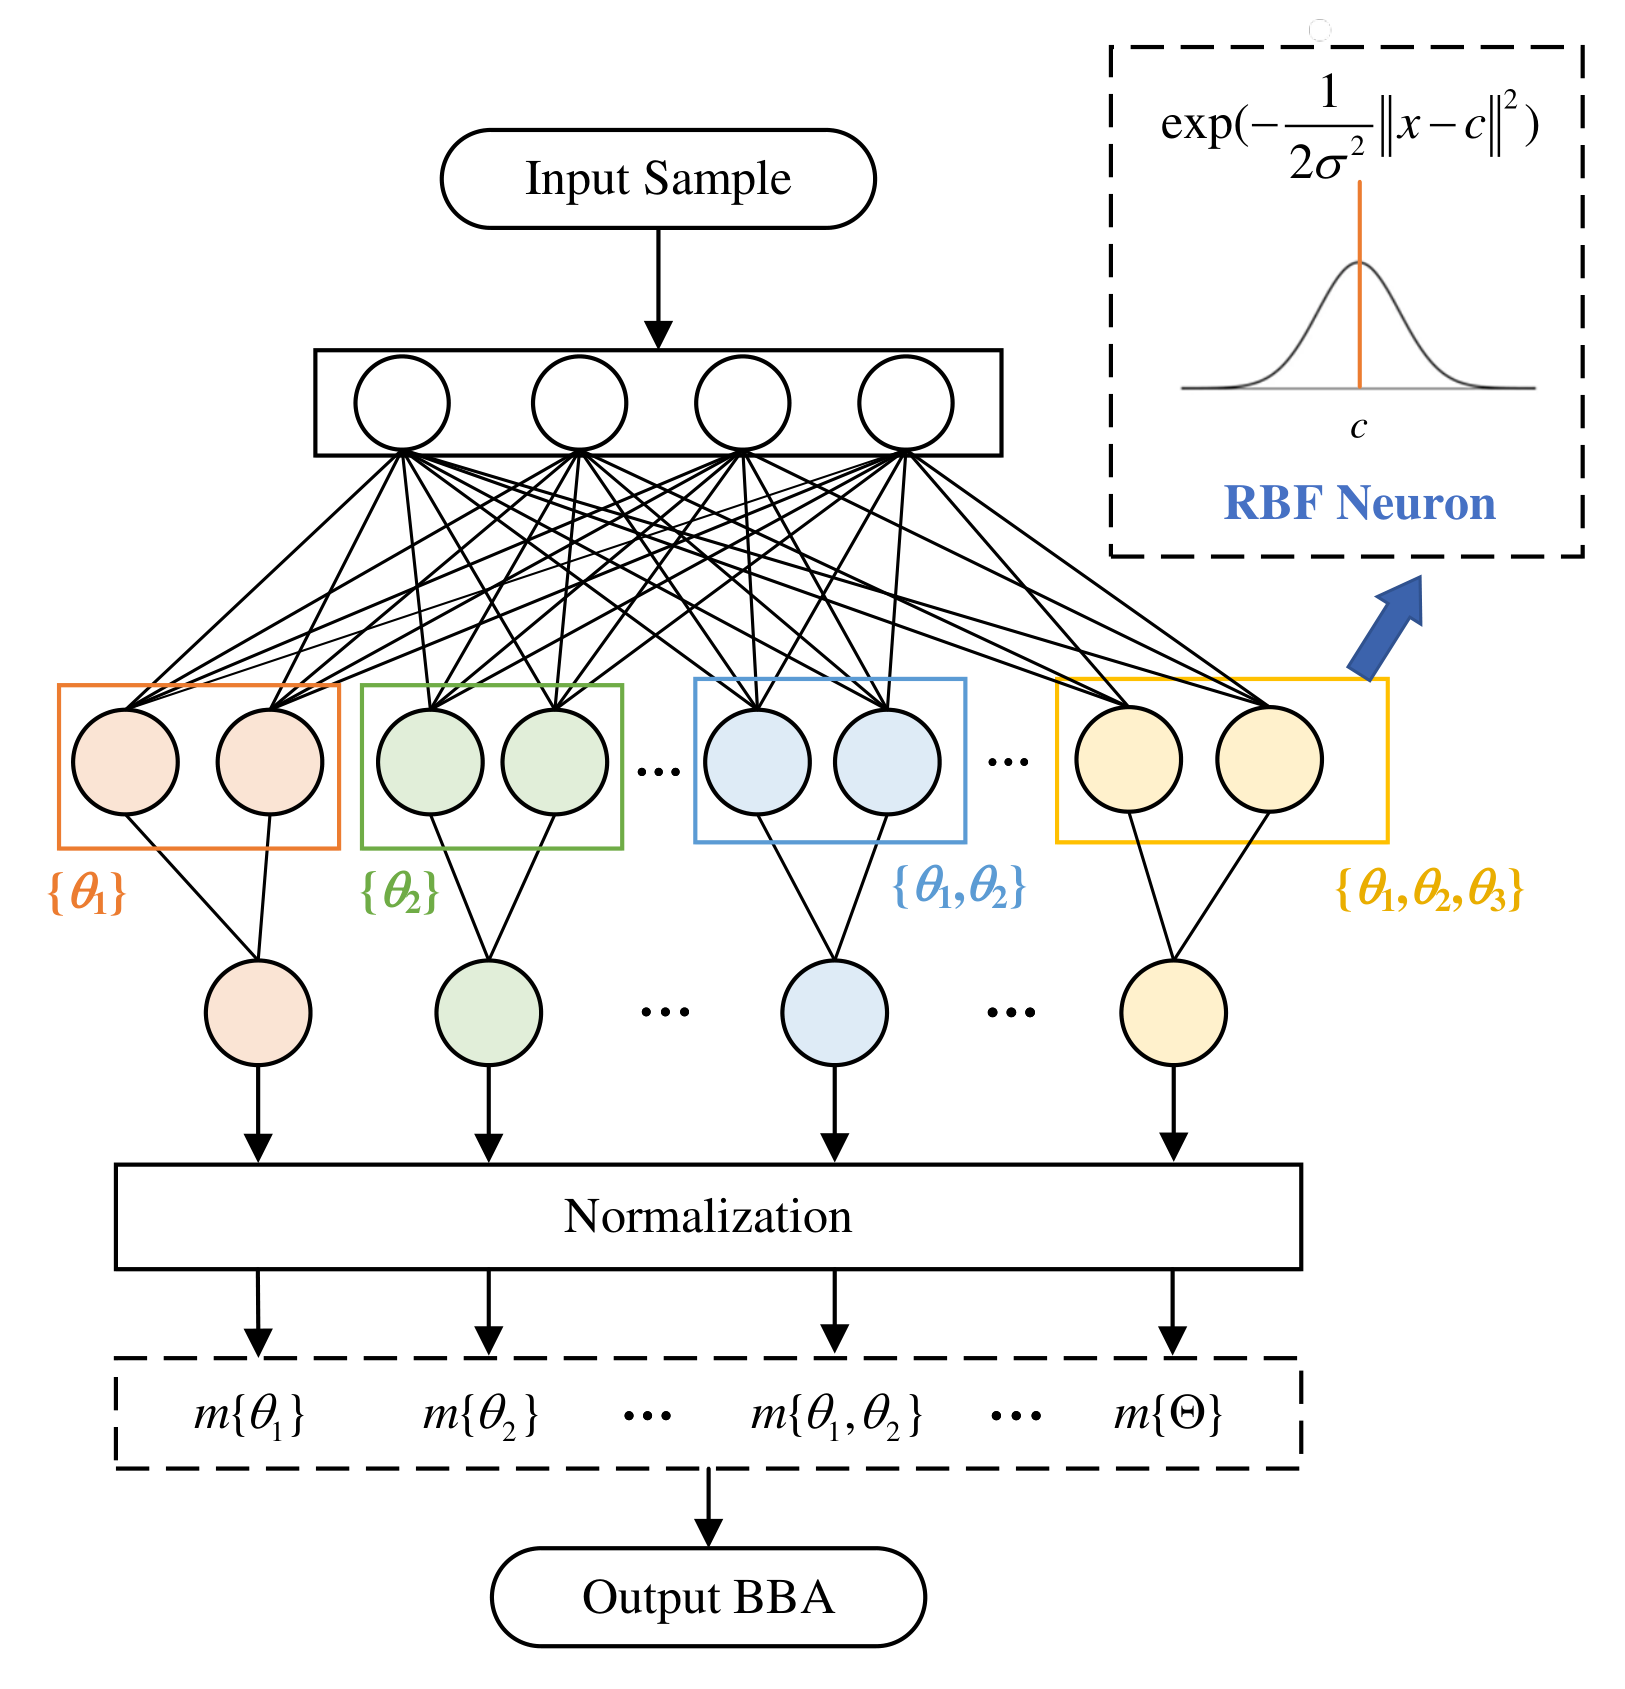
As shown in Figure 3, the input of E-RBFN is the data sample, and the output is the corresponding BBA. This end-to-end modal can directly determine the mass values for all compound focal elements.
In the structure of E-RBFN, we use the RBF neuron to represent the local region of each class (including the crisp class and the compound class). The activation function of the RBF neuron is defined as the radial basis function, as calculated in Eq. (12).
where is the input sample. is the -th RBF neuron center of class . is the variance of each RBF neuron.
In this paper, the RBF neuron centers are obtained by the -means clustering algorithm [19]. For example, for the compound class , we implement the -means algorithm in all samples belonging to this class, and then designate the cluster centers as the RBF neuron centers for . For the variance of the RBF neuron, we calculate it by the empirical formula [20].
where is the maximum distance between the centers of RBF neurons, is the number of RBF neurons.
3.3 E-RBFN's Application in Pattern Classification
In this section, we use an example to illustrate the process of our E-RBFN-based BBA determination method and its application in pattern classification, with the whole procedure shown in Figure 4. We use the Iris dataset [21] as an example to show our method. This dataset comprises 150 samples, distributed equally among three classes: Setosa (Se), Versicolor (Ve), and Virginica (Vi). We select 25 samples from each class to serve as the training set.
1) Select Compound-Class Samples: First, we select the compound-class samples using the confusion matrix and information entropy. Here, the confusion matrix is constructed by the cross validation (with the Bayesian decision) on training datasets, as shown in Table 1.
| Size | Predicted Class | |||
|---|---|---|---|---|
| Se | Ve | Vi | ||
| Actual Class | Se | 20 | 3 | 2 |
| Ve | 4 | 16 | 5 | |
| Vi | 4 | 3 | 18 | |
Then, we pick out the misclassified samples and calculate the corresponding entropy. For a sample misclassified between class and , if its entropy exceeds the threshold (set to 1), the misclassified sample is classified as . If its entropy is less than the threshold, it is classified as .
2) Construct E-RBFN: After selecting compound-class samples, we treat the compound classes as new class labels and construct the E-RBFN together with the crisp-class samples. In this example, there are seven classes: , , , , , and . The -means clustering algorithm is implemented on each class to obtain the RBF neuron centers ( is set to 2). The variance of each RBF neuron is calculated by Eq. (13).
3) BBA Determination Based on E-RBFN: Once the E-RBFN is constructed, it can be used for BBA determination to support the decision-making. To show this process, we select a test sample belonging to the class as an example. The feature values of this sample are as .
The selected sample is the input of the E-RBFN. Then, the E-RBFN can determine the mass values for each focal elements (including the singleton and compound ones) in an end-to-end manner, as , and .
Next, we transform this BBA into pignistic probability using Eq. (5), and we obtain . Finally, the test sample is classified as , which is consistent with the actual label.
4. Experiments
In the section, we conduct the evidence decision-based pattern classification experiments on multiple UCI [21] datasets and image datasets (from the Kaggle platform [22]) to evaluate the effectiveness of our proposed BBA determination method. The characteristics of these datasets are shown in Table 2.
| Dataset | Type | Class | Instance |
|---|---|---|---|
| WDBC | UCI | 2 | 569 |
| Thyroid | 3 | 215 | |
| CMC | 3 | 1473 | |
| Robot | 4 | 5456 | |
| Vowel | 6 | 871 | |
| Blood Cell | Image | 4 | 12500 |
| Crop Diseases | 5 | 21397 | |
| CIFAR-10 | 10 | 60000 | |
| Fashion-MNIST | 10 | 70000 |
| Average ± Std/% | Triplet | Discount | TFN | IN | E-RBFN | |
|---|---|---|---|---|---|---|
| WDBC | Accuracy | 89.72±1.37 | 88.60±1.45 | 90.91±1.47 | 89.16±1.68 | 91.46±1.88 |
| Precision | 89.86±2.45 | 88.01±1.71 | 90.72±0.98 | 88.91±2.06 | 91.82±0.86 | |
| Recall | 88.45±1.24 | 89.16±0.43 | 91.10±0.83 | 90.21±2.52 | 90.74±2.13 | |
| F1-Score | 88.93±1.82 | 88.25±1.82 | 90.91±1.17 | 90.54±0.64 | 91.09±0.81 | |
| Thyroid | Accuracy | 90.85±1.55 | 90.06±1.86 | 93.21±1.74 | 91.28±0.96 | 93.94±2.40 |
| Precision | 90.28±1.91 | 90.53±1.50 | 92.56±1.63 | 92.14±0.88 | 94.15±0.98 | |
| Recall | 91.02±2.41 | 89.94±1.23 | 93.34±0.28 | 91.66±0.51 | 94.05±0.85 | |
| F1-Score | 90.57±0.34 | 90.05±0.51 | 92.78±0.36 | 91.89±1.97 | 93.98±0.32 | |
| CMC | Accuracy | 62.12±1.36 | 62.36±1.32 | 64.52±0.64 | 63.29±1.23 | 66.94±1.66 |
| Precision | 62.23±1.91 | 62.87±0.43 | 63.94±2.12 | 62.48±0.85 | 65.89±0.97 | |
| Recall | 61.57±1.08 | 61.89±1.82 | 64.61±1.52 | 63.12±0.48 | 66.45±2.15 | |
| F1-Score | 61.81±1.91 | 62.02±0.53 | 64.00±0.64 | 62.63±1.94 | 66.16±0.88 | |
| Robot | Accuracy | 92.34±0.69 | 91.15±1.59 | 94.48±0.47 | 93.72±1.36 | 95.41±1.23 |
| Precision | 92.76±1.36 | 91.89±1.32 | 94.43±0.64 | 93.58±1.23 | 95.69±1.15 | |
| Recall | 93.12±1.59 | 92.55±1.64 | 95.28±1.15 | 94.24±0.64 | 95.12±2.37 | |
| F1-Score | 92.81±2.48 | 92.04±0.95 | 94.79±1.88 | 93.68±1.52 | 95.26±0.35 | |
| Vowel | Accuracy | 91.24±1.36 | 92.05±1.31 | 93.19±2.17 | 94.32±2.00 | 95.42±1.02 |
| Precision | 91.67±1.88 | 91.02±2.41 | 92.74±1.79 | 94.67±1.94 | 95.19±1.76 | |
| Recall | 92.14±2.07 | 91.56±1.18 | 93.25±0.95 | 93.45±1.25 | 96.03±0.88 | |
| F1-Score | 91.52±1.27 | 91.18±0.91 | 92.84±1.54 | 94.01±2.37 | 95.29±0.69 | |
| Blood Cell | Accuracy | 94.12±1.08 | 94.15±2.28 | 95.55±1.39 | 95.92±1.64 | 96.57±1.63 |
| Precision | 94.24±1.39 | 93.89±1.39 | 96.02±1.76 | 95.74±0.98 | 96.83±1.00 | |
| Recall | 94.61±0.48 | 94.07±1.64 | 95.94±1.39 | 95.45±2.34 | 97.16±1.38 | |
| F1-Score | 94.75±0.79 | 93.98±0.28 | 95.98±1.67 | 95.59±1.94 | 96.98±0.97 | |
| Crop Diseases | Accuracy | 91.34±2.26 | 92.15±1.13 | 94.56±2.29 | 96.12±1.39 | 96.35±0.45 |
| Precision | 91.47±0.47 | 91.98±2.36 | 94.63±0.98 | 95.01±1.22 | 96.28±1.82 | |
| Recall | 92.12±0.98 | 92.05±1.39 | 95.27±1.55 | 96.96±2.43 | 96.89±1.56 | |
| F1-Score | 91.89±2.52 | 92.03±1.35 | 94.90±2.08 | 95.98±1.28 | 96.72±1.95 | |
| CIFAR-10 | Accuracy | 92.56±1.95 | 93.28±2.59 | 94.40±0.58 | 94.12±1.56 | 95.74±1.25 |
| Precision | 92.34±1.36 | 93.10±2.47 | 95.02±0.97 | 93.81±2.19 | 94.56±0.87 | |
| Recall | 93.01±1.94 | 92.72±1.78 | 94.21±0.91 | 94.50±0.67 | 95.85±1.18 | |
| F1-Score | 92.38±1.39 | 92.98±0.45 | 94.39±1.74 | 94.16±1.08 | 95.54±0.99 | |
| Fashion-MNIST | Accuracy | 91.73±0.57 | 91.12±1.13 | 92.67±0.43 | 92.35±1.36 | 93.91±0.98 |
| Precision | 91.29±1.63 | 91.35±1.89 | 92.13±1.39 | 92.48±1.94 | 92.76±1.28 | |
| Recall | 92.18±2.12 | 90.58±2.56 | 93.19±0.45 | 92.72±1.78 | 93.84±1.05 | |
| F1-Score | 91.54±0.97 | 90.94±0.69 | 92.36±2.06 | 92.59±1.53 | 93.65±0.97 |
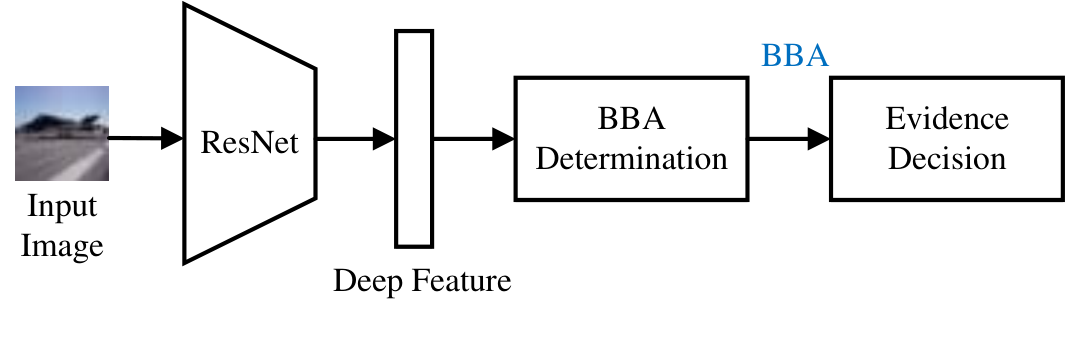
In the experiments, we compare the classification performance of our method with several traditional BBA determination methods: tri-focal element method [11], discount-based method [17], triangular fuzzy number (TFN)-based method [14] and interval number(IN)-based method [16]. For the E-RBFN, we set the number of layers to 3: the input layer corresponds to the sample feature dimensions, the middle layer is the RBF layer, and the output layer corresponds to the dimensions of the BBA. In the RBF layer, the number of RBF neurons for each class (including the compound classes) is set to 2 (for the simplicity, other values can also be used). For UCI datasets, we conducted the experiments on the original feature space of samples. For the image datasets, we first extract deep features by the pre-trained ResNet50 model (the deep features before its fully connected layer) [23]. Next, the evidence decision-based pattern classification experiments are conducted on these deep feature spaces. This process for image datasets is shown in Figure 5.
In the experiments, each dataset is divided into two parts, with 50% assigned to the training set and 50% to the test set. The experiment on each dataset is randomly performed ten times. We calculate the average and variance of four measures, including accuracy, precision, recall, and f1-score. The results are shown in Table 3. As we can see, our proposed method performs globally much better than several traditional BBA determination methods on multiple UCI and image datasets (with p-values less than 0.05 in Wilcoxon signed-rank tests), especially for the methods that determine the mass values of compound focal elements using the singleton focal elements (i.e., the tri-focal element method and the discount-based method). This indicates that by introducing the compound classes and learning mechanism, our E-RBFN offers superior advantages over the traditional heuristic approaches.
5. Conclusions
To better determine the BBA, especially for the mass determination for compound focal elements, we design the BBA determination process as an end-to-end model called E-RBFN. This model can directly determine the mass values of all focal elements (including the singleton and compound ones). Experimental results of evidence fusion decision-based pattern classification on multiple UCI and image datasets show that our method is effective and reasonable.
Note that in our approach, compound-class samples are obtained by the confusion matrix and information entropy, which may depend on the parameter settings. In future work, we will attempt to use the inherent ambiguity or uncertainty in the data to obtain compound-class samples, thus reducing reliance on parameters.
Data Availability Statement
Funding
Conflicts of Interest
Ethical Approval and Consent to Participate
References
- Dempster, A.P. (1967) Upper and Lower Probabilities Induced by a Multivalued Mapping. The Annals of Mathematical Statistics, 38, 325-339.
- Shafer, G. (1976). A Mathematical Theory of Evidence. Princeton University Press.
- Richter, S., Bieder, F., Wirges, S., Kinzig, C., & Stiller, C. (2022, July). Sensor data fusion in top-view grid maps using evidential reasoning with advanced conflict resolution. In 2022 25th International Conference on Information Fusion (FUSION) (pp. 1-7). IEEE.
- Sharma, M., & Maity, T. (2022, November). Fault-tolerant multi-sensor data fusion system for underground mine gas hazard prediction using Dempster Shafer Evidence Theory. In 2022 IEEE 6th Conference on Information and Communication Technology (CICT) (pp. 1-5). IEEE.
- Jin, J., Qu, T., Xu, R., Wang, X., & Cichocki, A. (2022). Motor imagery EEG classification based on Riemannian sparse optimization and dempster-shafer fusion of multi-time-frequency patterns. IEEE Transactions on Neural Systems and Rehabilitation Engineering, 31, 58-67.
- Zhao, J., Shi, Y., Liu, W., Zhou, T., Li, Z., & Li, X. (2023). A hybrid method fusing frequency recognition with attention detection to enhance an asynchronous brain-computer interface. IEEE Transactions on Neural Systems and Rehabilitation Engineering, 31, 2391-2398.
- Sun, L., & Wang, Y. (2018). A multi-attribute fusion approach extending Dempster–Shafer theory for combinatorial-type evidences. Expert Systems with Applications, 96, 218-229.
- Xiao, F., Wen, J., & Pedrycz, W. (2022). Generalized divergence-based decision making method with an application to pattern classification. IEEE transactions on knowledge and data engineering, 35(7), 6941-6956.
- Han, D., Yang, Y., & Han, C. (2014). Advances in DS evidence theory and related discussions. Control and Decision, 29(1), 1-11.
- Selzer, F., & Gutfinger, D. (1989, January). LADAR and FLIR based sensor fusion for automatic target classification. In Sensor fusion: Spatial reasoning and scene interpretation (Vol. 1003, pp. 236-246). SPIE.
- Bi, Y., Bell, D., & Guan, J. (2004). Combining evidence from classifiers in text categorization. In Knowledge-Based Intelligent Information and Engineering Systems: 8th International Conference, KES 2004, Wellington, New Zealand, September 20-25, 2004, Proceedings, Part III 8 (pp. 521-528). Springer Berlin Heidelberg.
- Zhang, Z., Han, D., & Yang, Y. (2015, October). Image segmentation based on evidential Markov random field model. In 2015 International Conference on Control, Automation and Information Sciences (ICCAIS) (pp. 239-244). IEEE.
- Dezert, J., Liu, Z. G., & Mercier, G. (2011, July). Edge detection in color images based on DSmT. In 14th International Conference on Information Fusion (pp. 1-8). IEEE.
- Jiang, W., Duanmu, D., Fan, X., & Deng, Y. (2012, May). A new method to determine basic probability assignment under fuzzy environment. In 2012 International Conference on Systems and Informatics (ICSAI2012) (pp. 758-762). IEEE.
- Han, D., Han, C., & Deng, Y. (2013). Novel approaches for the transformation of fuzzy membership function into basic probability assignment based on uncertainty optimization. International Journal of Uncertainty, Fuzziness and Knowledge-Based Systems, 21(02), 289-322.
- Kang, B. Y., Li, Y. A., Deng, Y., Zhang, Y. J., & Deng, X. Y. (2012). Determination of basic probability assignment based on interval numbers and its application. Dianzi Xuebao(Acta Electronica Sinica), 40(6), 1092-1096.
- Zhang, S., Han, D., & Yang, Y. (2020). Active learning based on belief functions. SCIENCE CHINA-INFORMATION SCIENCES, 63(11).
- Smets, P., & Kennes, R. (1994). The transferable belief model. Artificial intelligence, 66(2), 191-234.
- Kanungo, T., Mount, D. M., Netanyahu, N. S., Piatko, C. D., Silverman, R., & Wu, A. Y. (2002). An efficient k-means clustering algorithm: Analysis and implementation. IEEE transactions on pattern analysis and machine intelligence, 24(7), 881-892.
- Zhu, Q., Cai, Y., & Liu, L. (1999). A global learning algorithm for a RBF network. Neural Networks, 12(3), 527-540.
- Asuncion, A., & Newman, D. (2007, November). UCI machine learning repository. Retrieved from https://archive.ics.uci.edu/ml
- Kaggle. (n.d.). Kaggle: Your machine learning and data science community. Retrieved from https://www.kaggle.com
- He, K., Zhang, X., Ren, S., & Sun, J. (2016). Deep residual learning for image recognition. In Proceedings of the IEEE conference on computer vision and pattern recognition (pp. 770-778).
Cite This Article
Article Metrics
Citations:Article Access Statistics:
Publisher's Note
ICCK stays neutral with regard to jurisdictional claims in published maps and institutional affiliations.
Rights and Permissions

Copyright © 2024 by the Author(s). Published by Institute of Central Computation and Knowledge.
This article is an open access article distributed under the terms and conditions of the Creative Commons Attribution (CC BY) license.